The producer price index for final demand excluding food and energy rose 5.0 per cent in the year to September, the highest rate since January 2023. A year earlier the rate was 3.0 per cent. Over the same twelve months the consumer price index excluding food and energy rose 2.6 per cent.
Producer prices measure what businesses receive; consumer prices measure what households pay. The two are not the same basket, but they share a direction, and the question this note asks is whether the gap now open between them is a cost that has yet to reach consumers or something narrower.
The Widest Gap Since 2022
The difference between the two core rates was 2.4 percentage points in September. The last time it was as wide was June 2022.
Core Producer and Consumer Prices, Annual Change
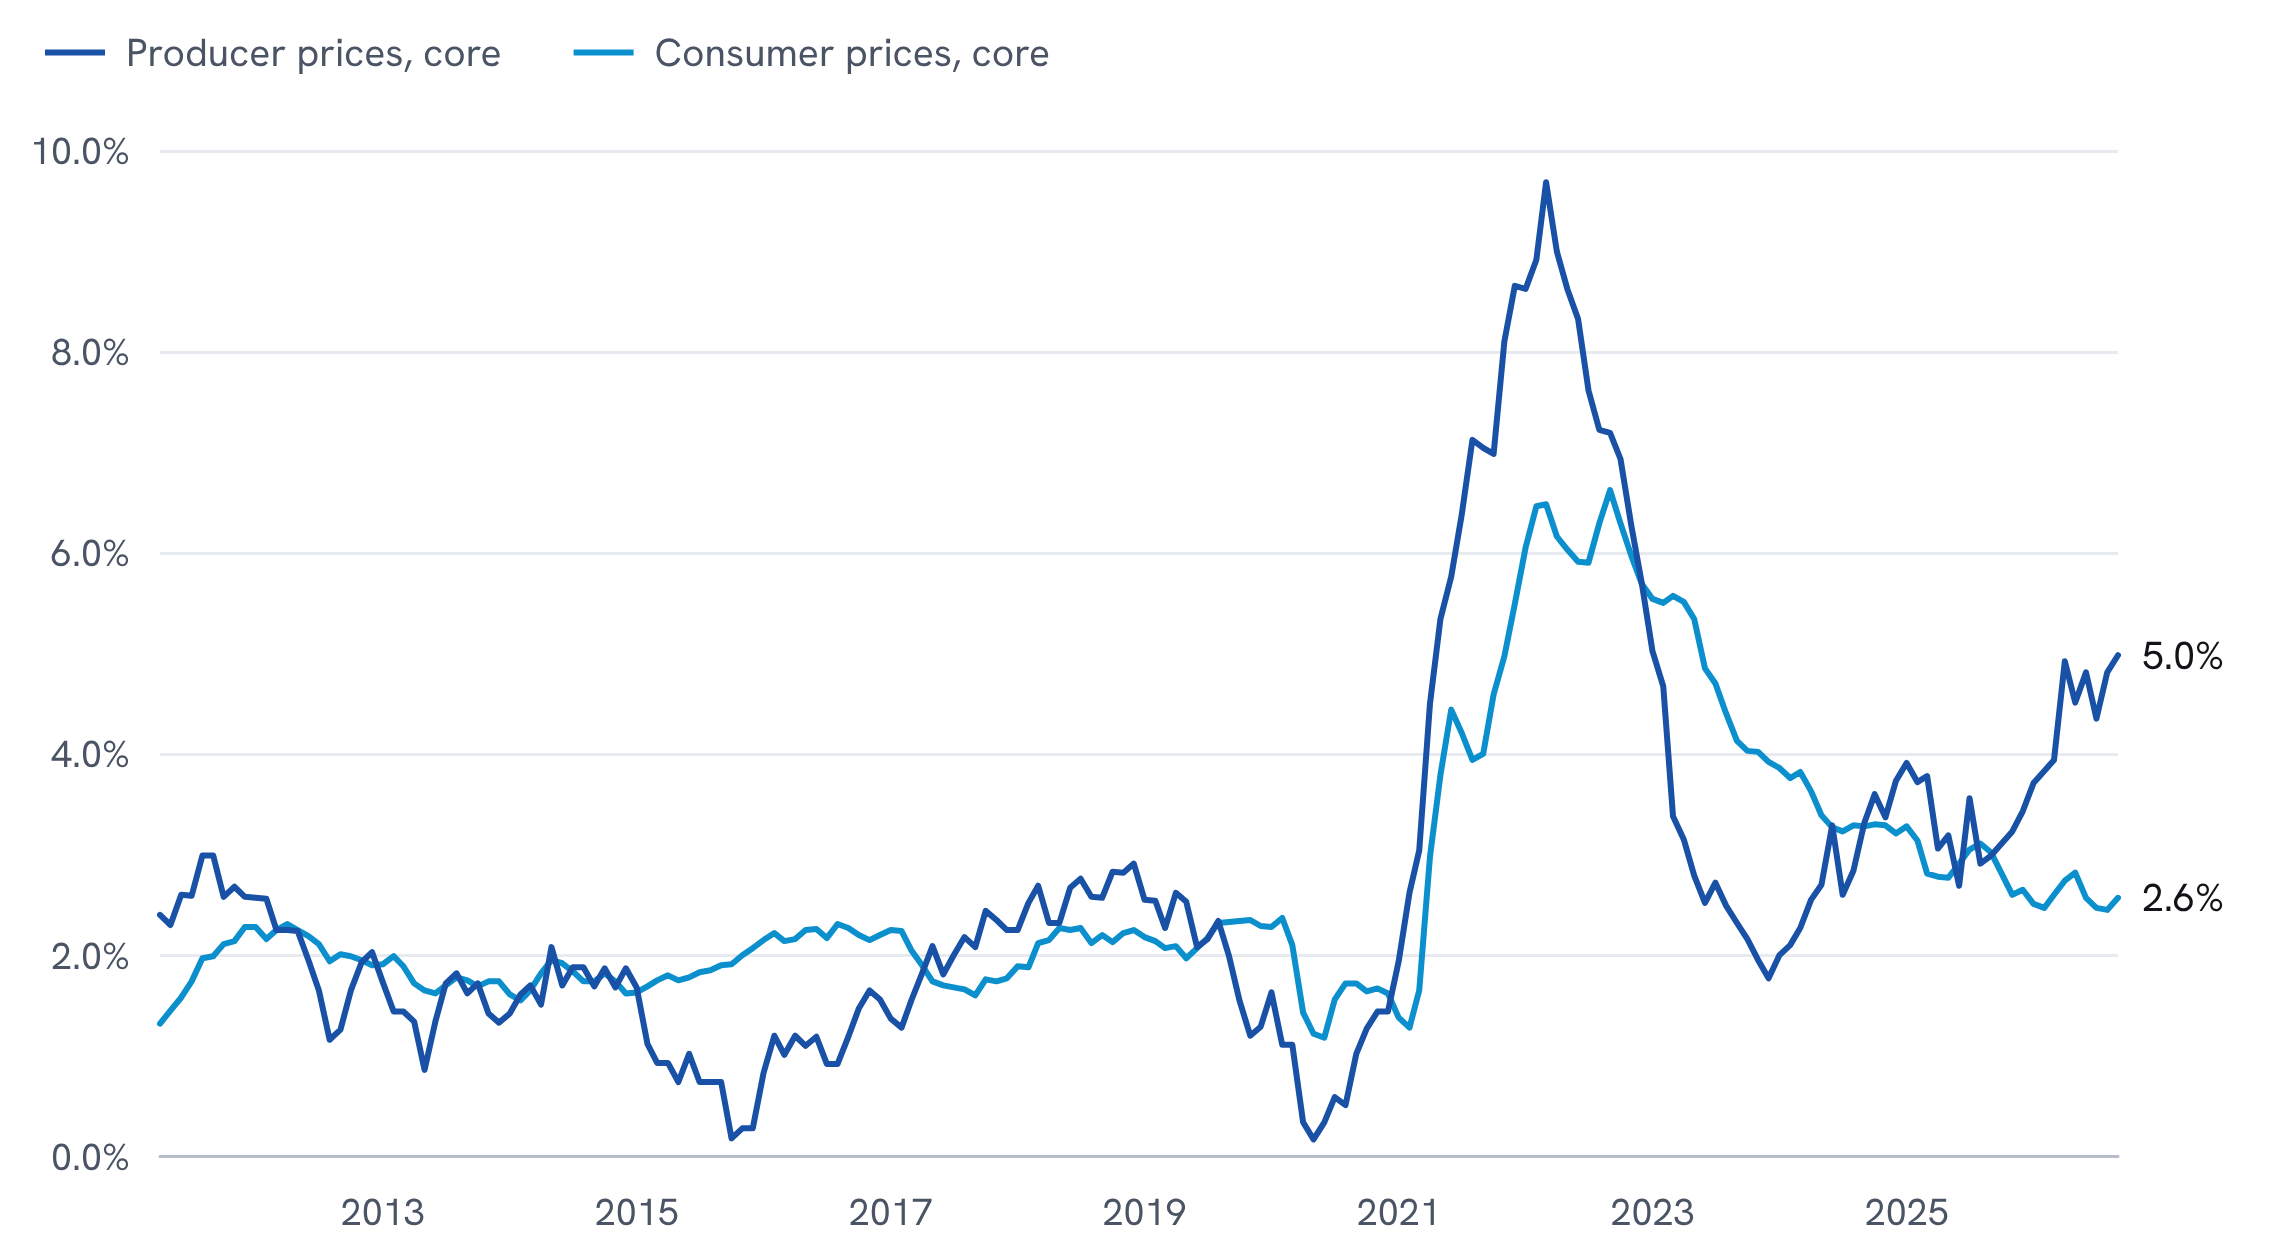
Percentage change from a year earlier in the producer price index for final demand less foods and energy and the consumer price index for all urban consumers less food and energy, seasonally adjusted, monthly, April 2011 to September 2026.
Source: U.S. Bureau of Labor Statistics, Producer Price Index and Consumer Price Index, retrieved from FRED, Federal Reserve Bank of St Louis, on 9 November 2026. Seven Measures calculations.
No consumer price index was published for October 2025, so the consumer line has no value for that month and is joined across it.
Between 2011 and 2020 the two rates were within a point of each other in four months out of five, and never more than 1.8 points apart. They separated in 2021, when core producer prices rose to 9.7 per cent in March 2022 and core consumer prices followed to 6.6 per cent in September 2022. The present gap is smaller than the one that opened then, but it has opened in the same direction.
Producer Prices Have Led by About Five Months
The relationship between the two series is closer when producer prices are read a few months ahead.
Core Consumer Inflation Against Earlier Core Producer Inflation
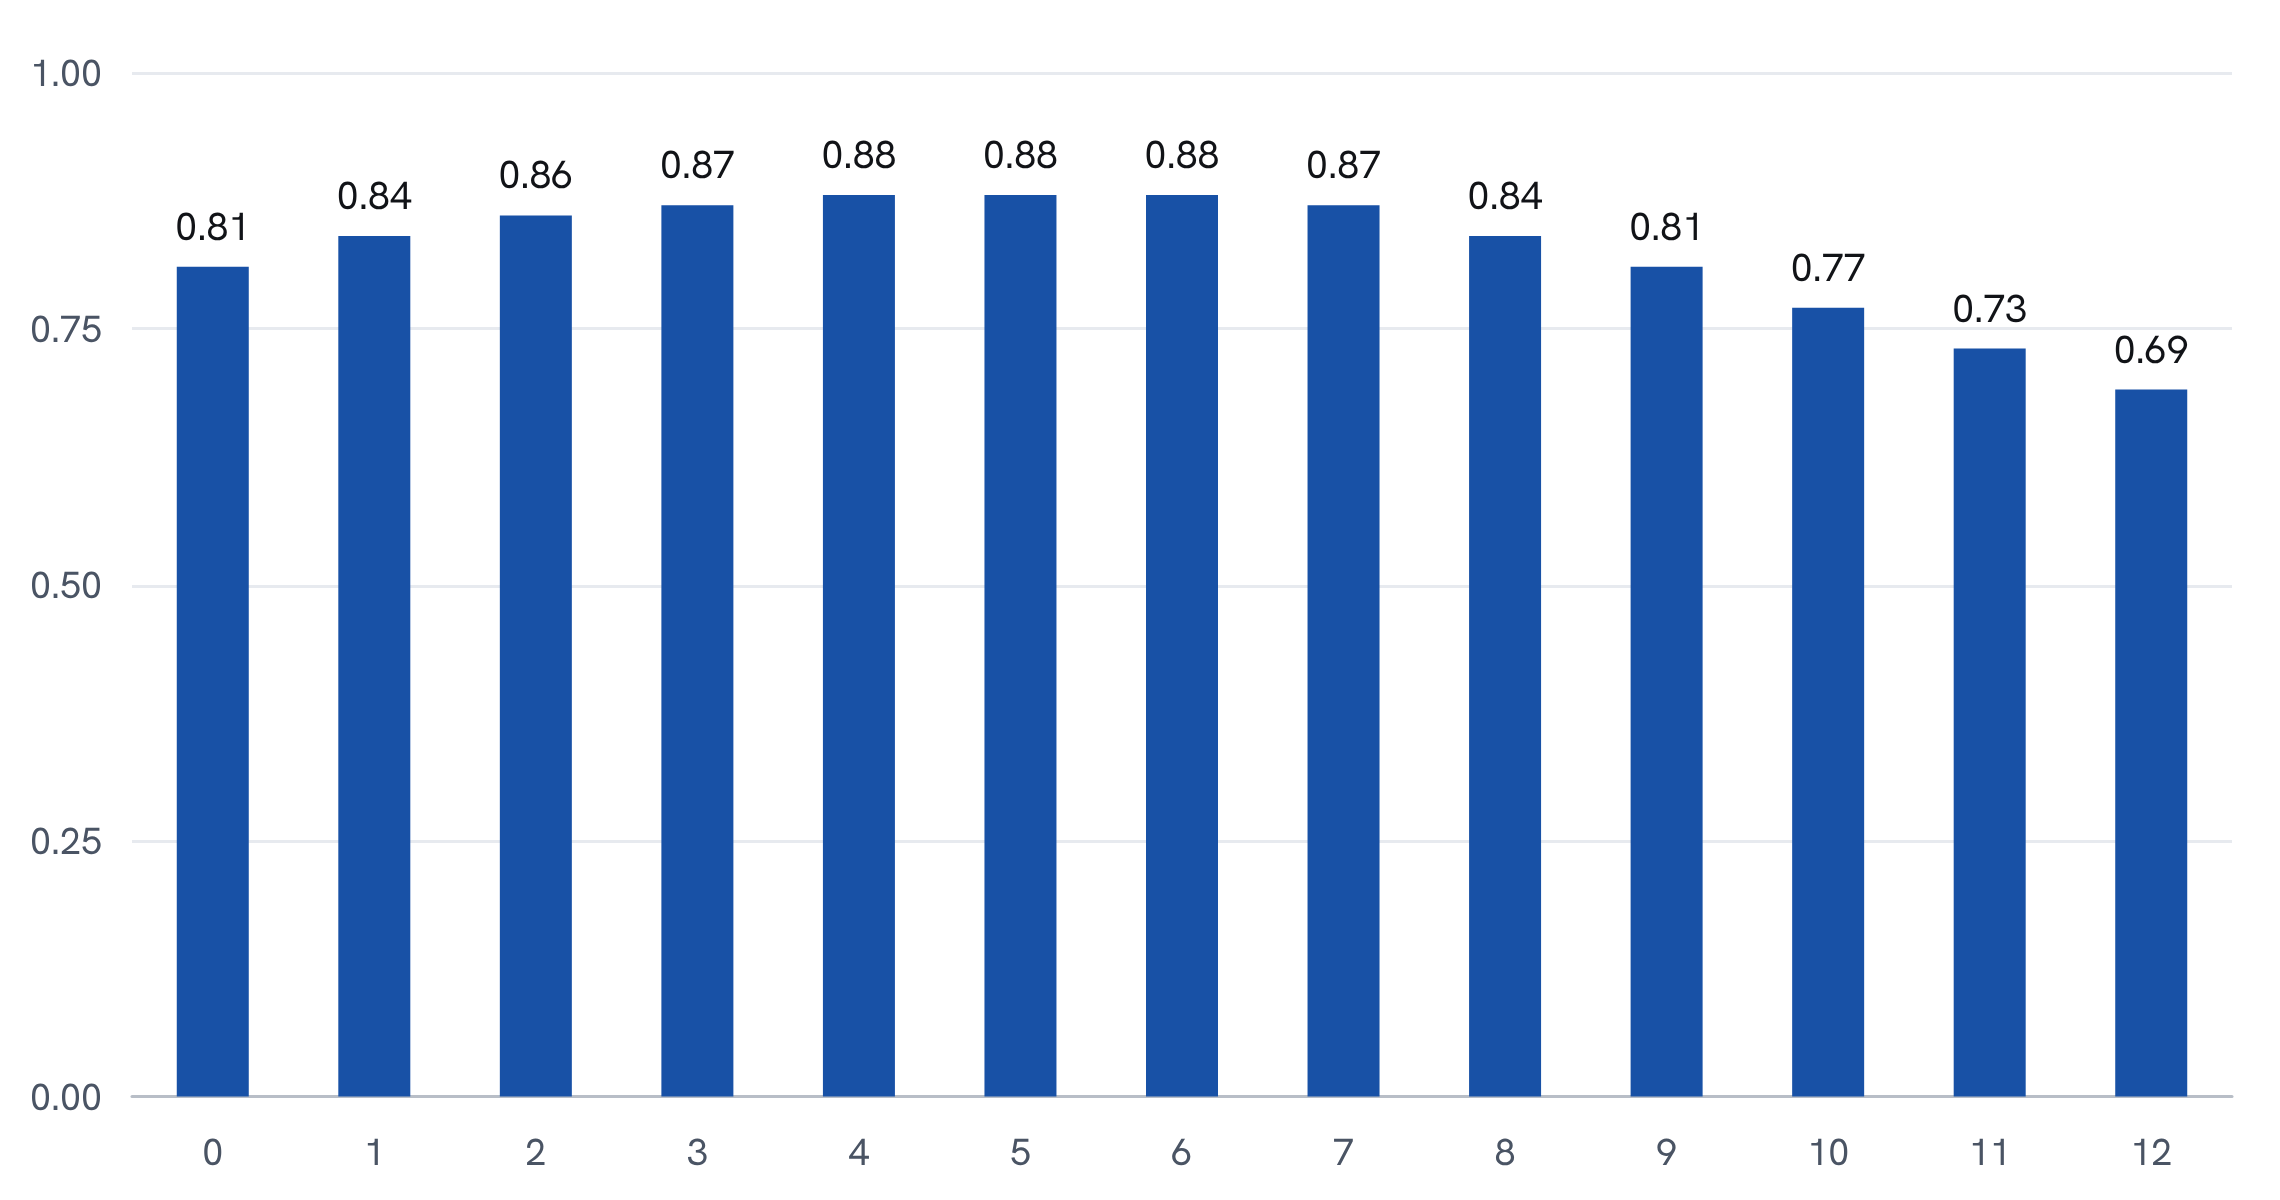
Correlation coefficient between the annual change in core consumer prices in a month and the annual change in core producer prices zero to twelve months earlier, monthly observations from April 2011 to September 2026.
Source: U.S. Bureau of Labor Statistics, Producer Price Index and Consumer Price Index, retrieved from FRED, Federal Reserve Bank of St Louis, on 9 November 2026. Seven Measures calculations.
The sample holds between 173 and 185 monthly pairs depending on the lead. The coefficients are dominated by the 2021 to 2023 episode, when both series moved furthest.
The correlation is 0.81 with no lag and 0.88 when producer prices are read four to six months earlier, highest at five. That is consistent with the 2022 episode, when the two peaks were six months apart. Read mechanically, it says September's producer prices describe core consumer inflation in the first quarter of 2027. Whether they do depends on what is driving them.
The Acceleration Is Concentrated in Freight
The producer index excludes food and energy as products. It does not exclude the cost of moving goods, and that is where this year's increase sits.
Components of Core Producer Prices, Annual Change
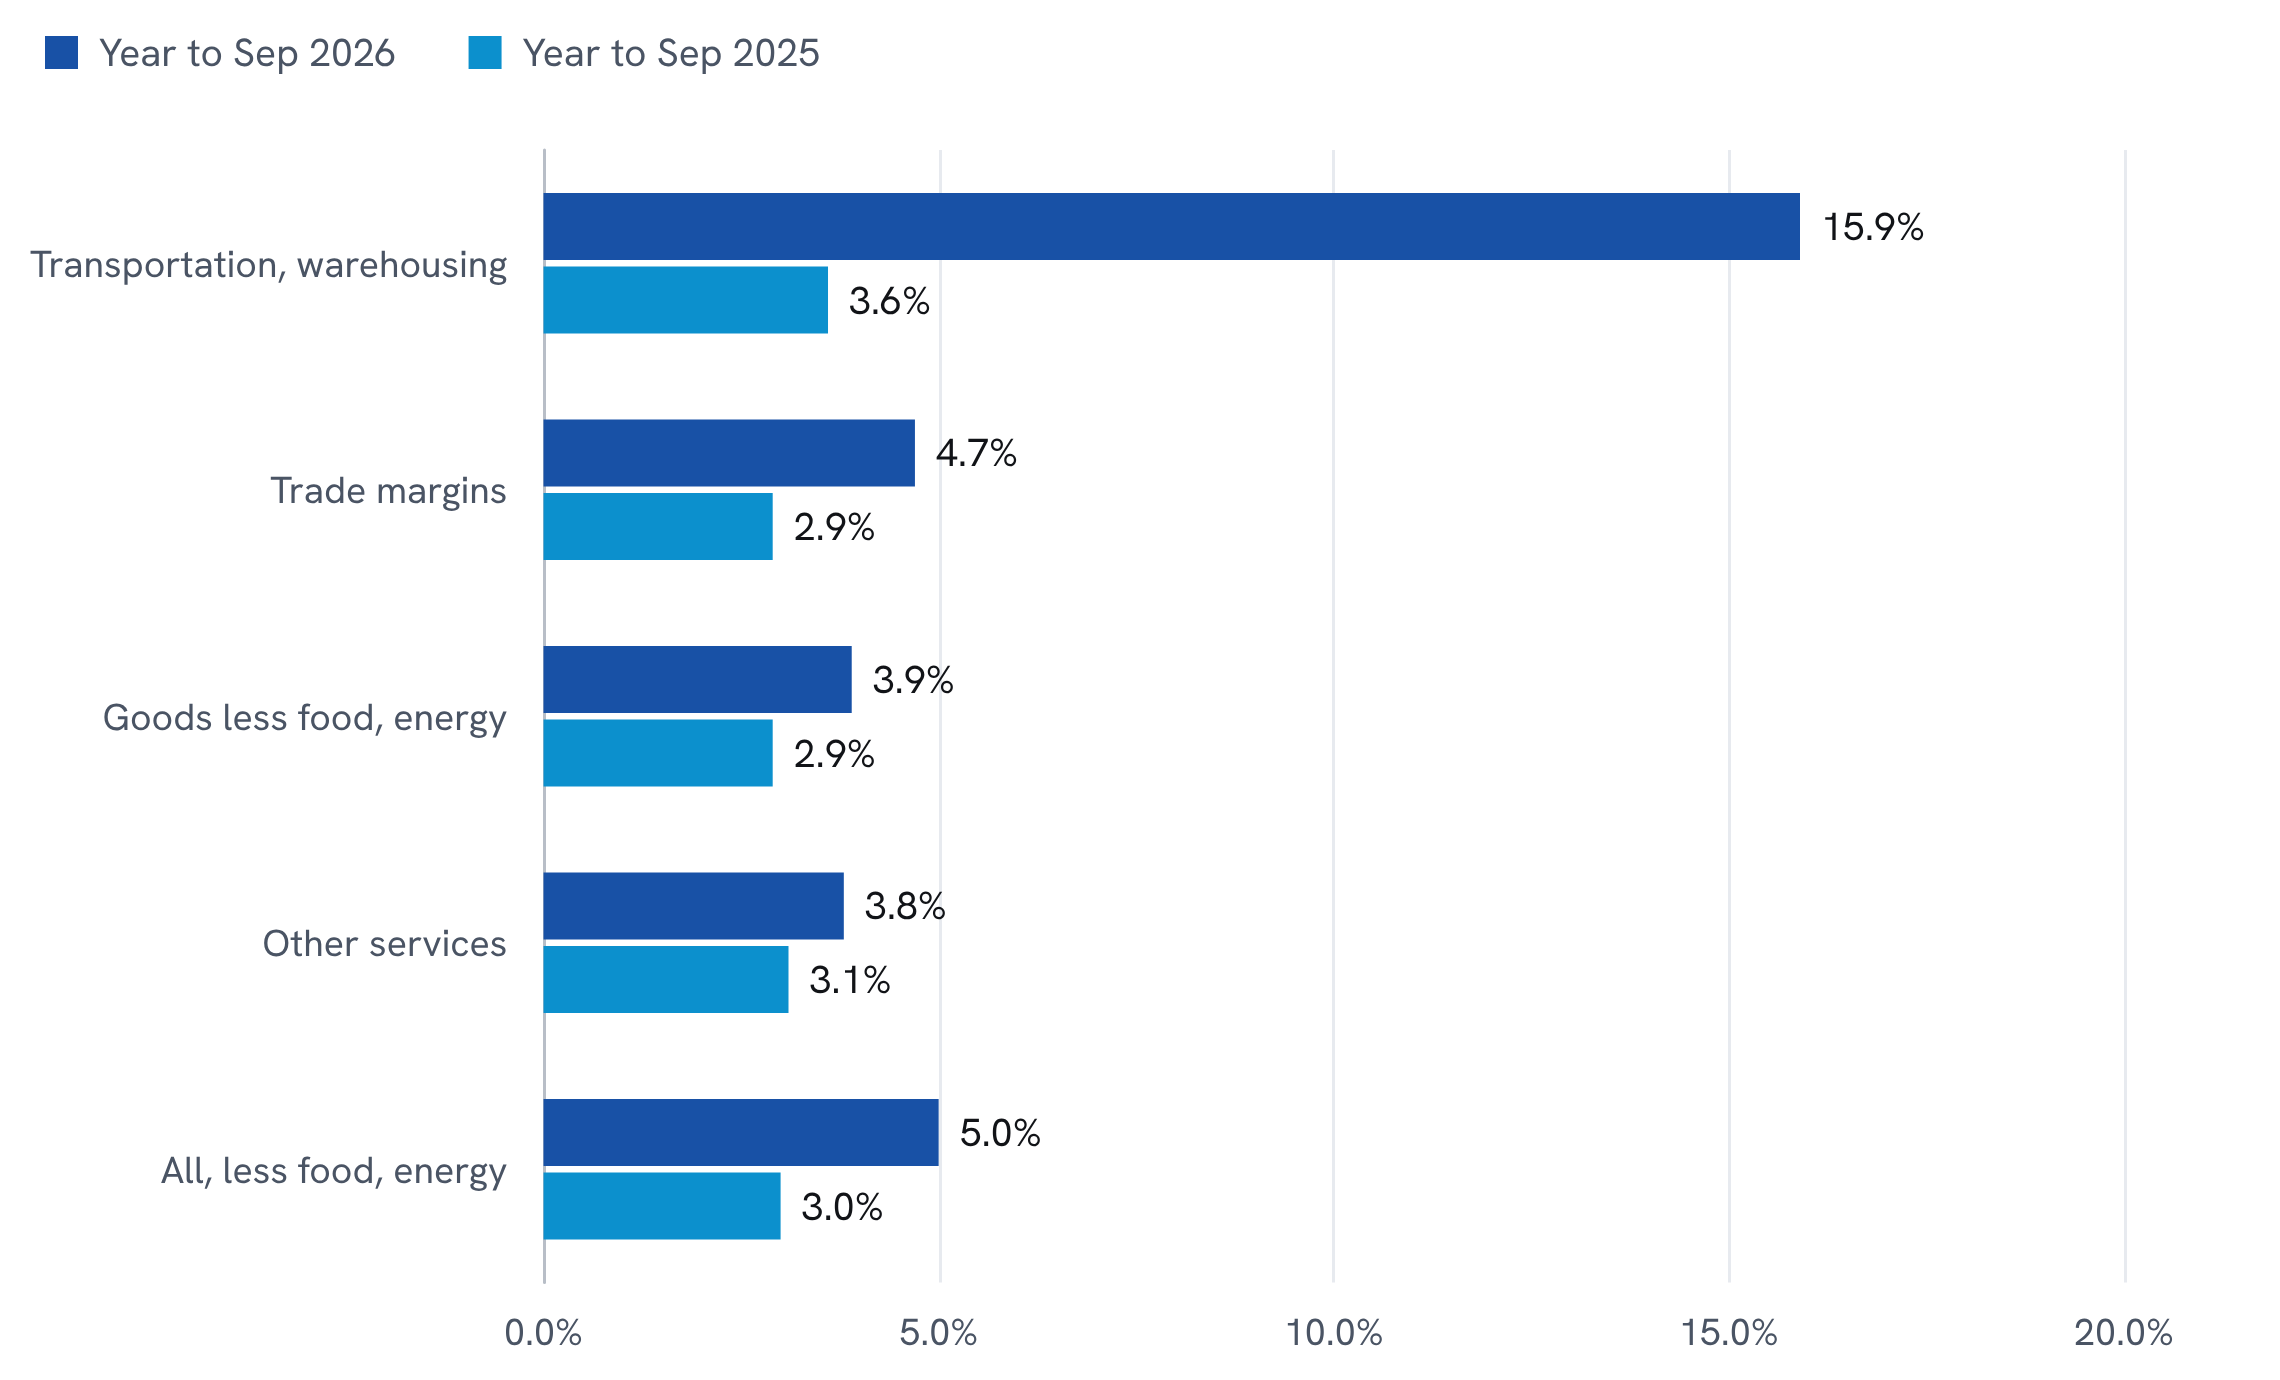
Percentage change from a year earlier in producer price indexes for final demand transportation and warehousing services, trade services, finished goods less foods and energy, services less trade, transportation and warehousing, and final demand less foods and energy, seasonally adjusted, years to September 2025 and September 2026.
Source: U.S. Bureau of Labor Statistics, Producer Price Index, retrieved from FRED, Federal Reserve Bank of St Louis, on 9 November 2026. Seven Measures calculations.
The components are shown as published and are not weighted; their contributions to the aggregate are not calculated here.
Transportation and warehousing services rose 15.9 per cent in the year to September, against 3.6 per cent a year earlier. Brent crude averaged $123.93 a barrel in October, against $64.54 in October 2025. Trade margins rose 4.7 per cent and goods excluding food and energy 3.9 per cent. Services excluding trade, transportation and warehousing rose 3.8 per cent, against 3.1 per cent a year earlier.
The consumer side shows the same split. Energy prices paid by households rose 20.4 per cent and headline consumer prices 3.7 per cent, while the core index rose 2.6 per cent and the Federal Reserve's preferred core measure, the personal consumption expenditures price index excluding food and energy, 3.1 per cent.
Investment Implications
The firm reads one thing from this. A rising core producer figure is usually read as inflation spreading beyond energy, and on its history it has tended to lead core consumer prices. This year's rise is concentrated in freight, which is energy entering the core measure through the cost of transport. Services excluding transport and trade have accelerated by less than a point.
The Federal Open Market Committee held its target range at 3¾ to 4 per cent on 28 October, saying that “inflation remains elevated”, with two members preferring a quarter-point increase. Our base case assumes crude stays below its October average, as it was on 3 November at $107.03, so freight costs stop accelerating and core consumer inflation rises modestly from 2.6 per cent rather than following producer prices towards 5 per cent. A renewed rise in crude, or acceleration in services excluding transport, would raise the likelihood of a different path in which the 2022 pattern repeats.
What resolves it is dated. The October consumer price index is published on 10 November and the October producer price index on 13 November. The work this note has not done is to weight the producer components by their relative importance, which would turn the direction shown here into a measured share.