The average price of regular gasoline in the United States was $2.81 a gallon in January. It reached $4.48 in May and was $4.31 in October, and $3.995 in the week of 9 November. That is a larger rise, in dollars, than the one that took gasoline above $4 in the summer of 2008.
In 2008 buyers responded by changing what they bought. Cars, which use less fuel than the pickups and sport utility vehicles counted as light trucks, took a larger share of sales within months. This note asks whether the same thing has happened this year, and finds that it has not, for a reason that has more to do with the vehicles on offer than with the price of fuel.
A Fuel Shock Larger Than 2008
This year's price is not a record. It was higher in 2022. But the rise from January was $1.67, against $1.02 in the first seven months of 2008.
Regular Gasoline Price, Monthly Average
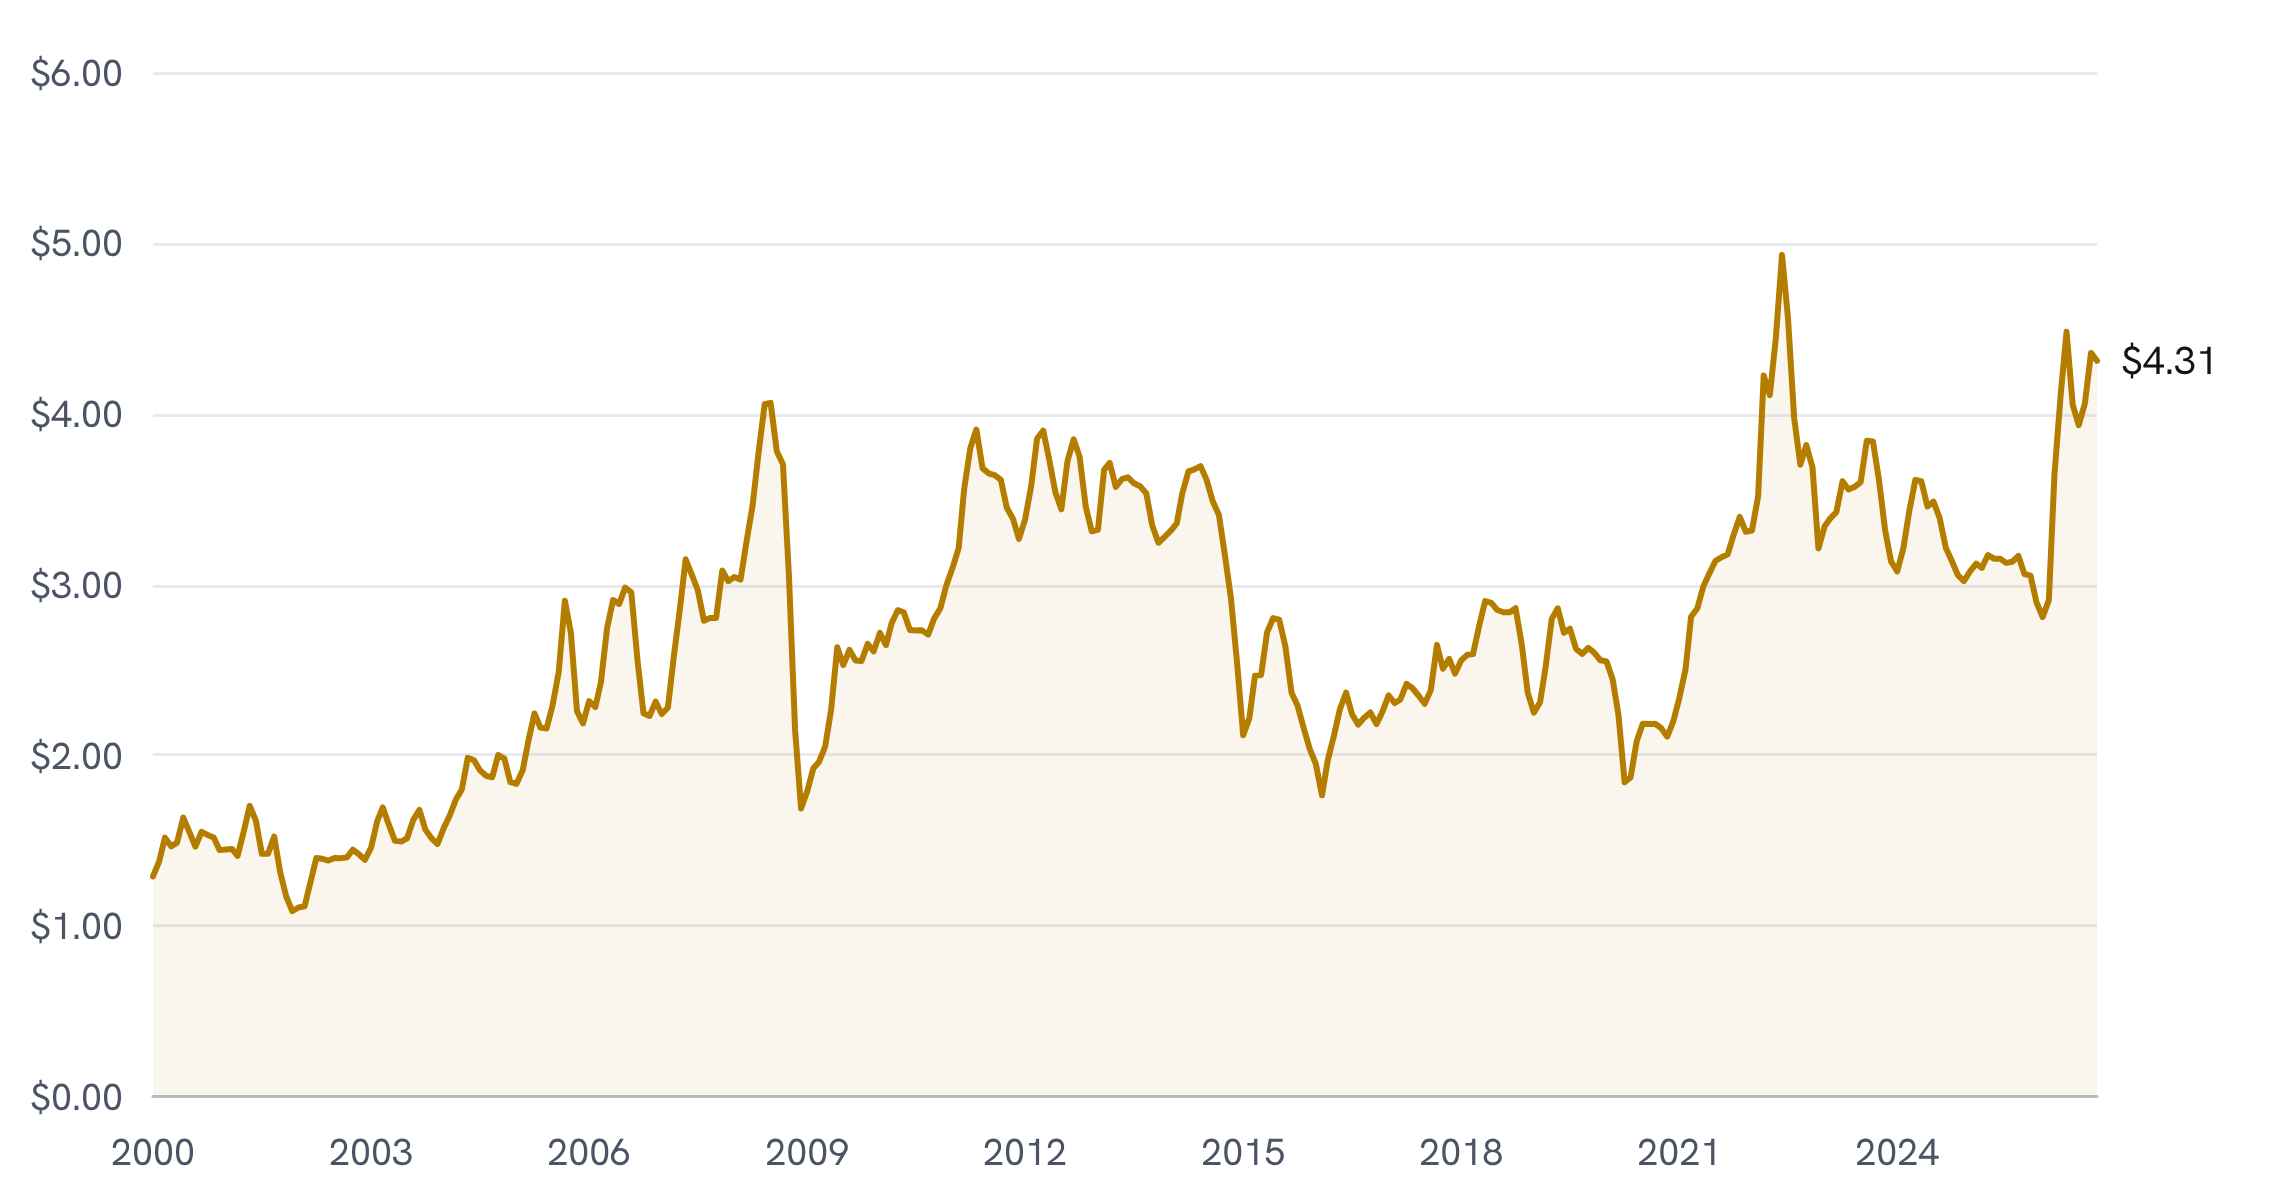
U.S. regular gasoline, all formulations, retail price, $ per gallon, average of weekly prices in each month, January 2000 to October 2026.
Source: U.S. Energy Information Administration, Gasoline and Diesel Fuel Update, retrieved from FRED, Federal Reserve Bank of St Louis, on 13 November 2026. Seven Measures calculations.
The Mix Did Not Move
The comparison that matters is what buyers did as the price rose. Each episode below runs from January to the month of that year's highest average price.
Three Gasoline Price Rises Compared
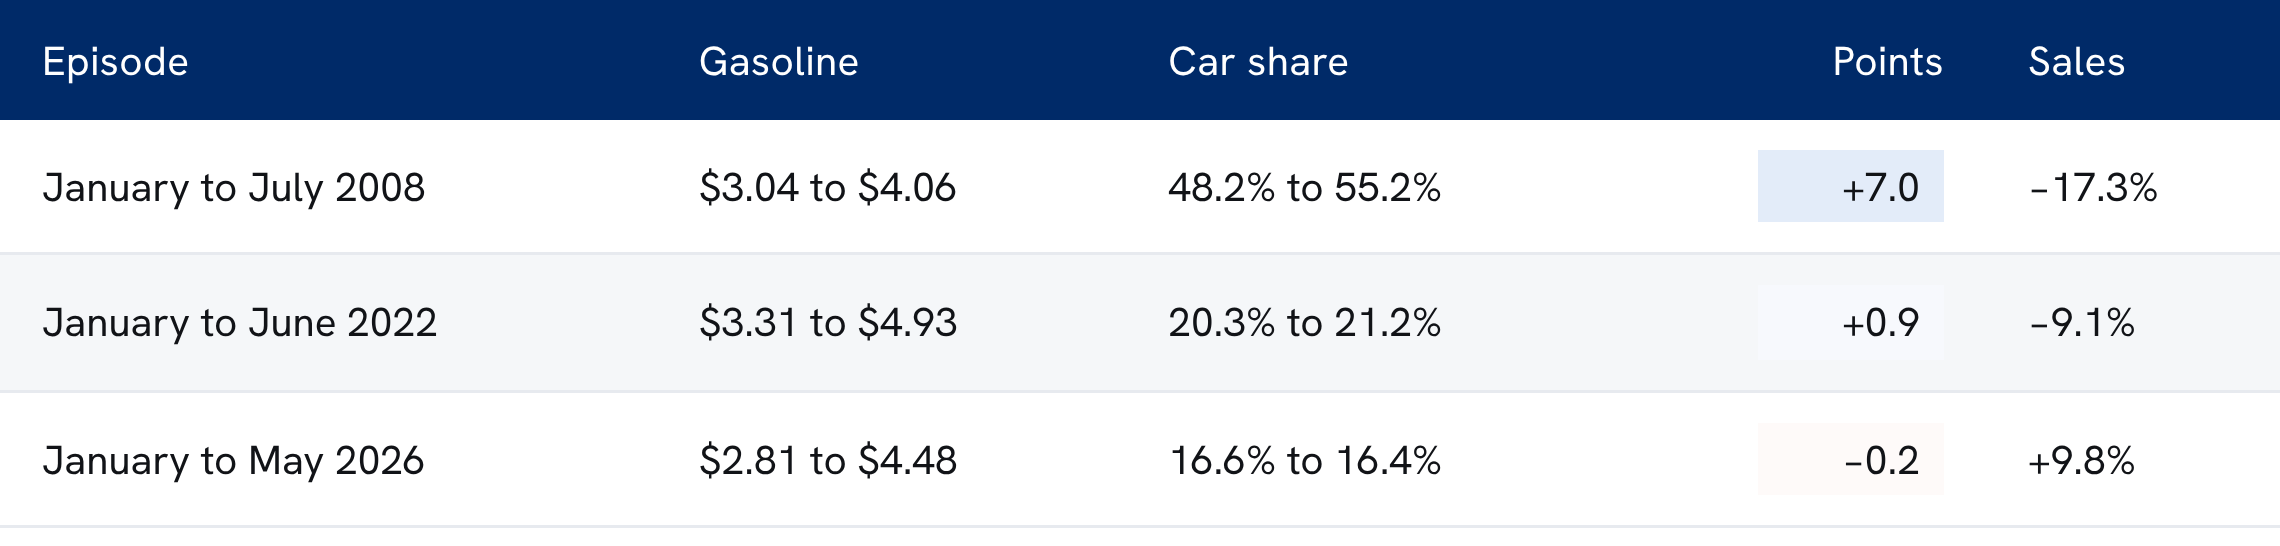
Regular gasoline, monthly average price; cars as a share of light weight vehicle sales; and the change in total light weight vehicle sales at a seasonally adjusted annual rate; each from January to the month of the year's highest average gasoline price.
Source: U.S. Energy Information Administration; U.S. Bureau of Economic Analysis, Supplemental Estimates, Motor Vehicles; retrieved from FRED, Federal Reserve Bank of St Louis, on 13 November 2026. Seven Measures calculations.
The change in points is calculated from the shares as shown. Car and light truck sales sum to total light vehicle sales within 0.001 million in every month since 1976.
In 2008 the car share rose from 48.2 per cent to 55.2 per cent in six months. In 2022 it rose by less than a point. This year it was 16.6 per cent in January and 16.4 per cent in May, and 15.8 per cent in October with gasoline still above $4. Car sales did rise, by 8.8 per cent between January and May to 2.70 million at an annual rate, but light trucks rose by 10.0 per cent and the mix held.
Total sales behaved differently too. They fell in both earlier episodes. This year they rose 9.8 per cent between January and May and reached 16.76 million in June, before falling back to 15.54 million in October.
There Is Little Left to Shift
The reason the mix did not move is visible in the longer record. In 2008 buyers had cars to move to.
Cars as a Share of Light Vehicle Sales
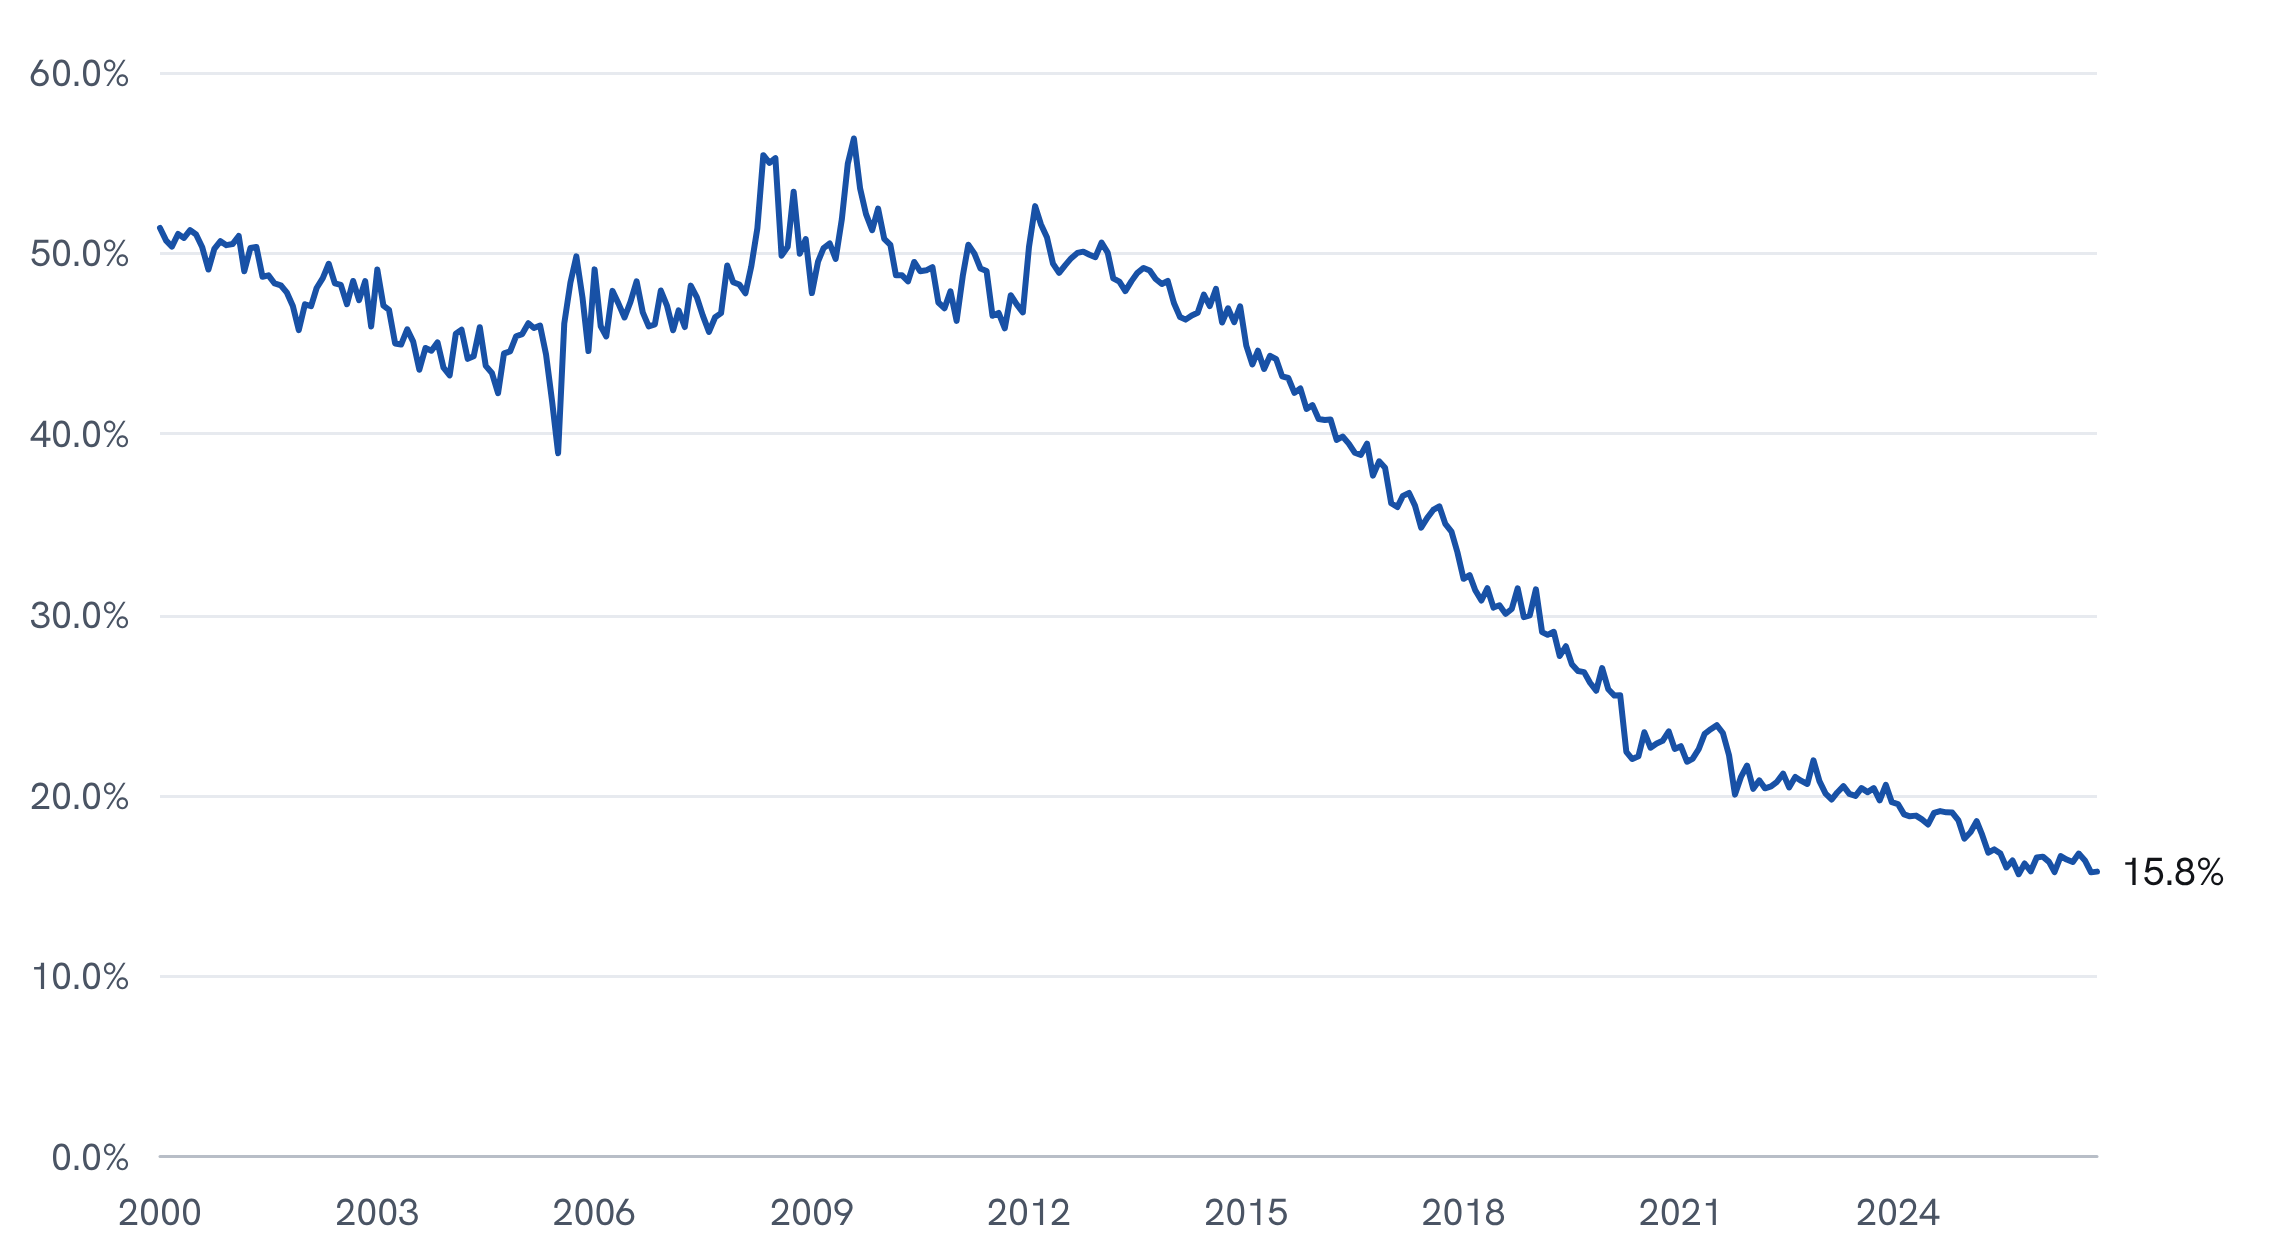
Domestic and foreign autos as a share of light weight vehicle sales, autos and light trucks, seasonally adjusted annual rates, monthly, January 2000 to October 2026.
Source: U.S. Bureau of Economic Analysis, Supplemental Estimates, Motor Vehicles, retrieved from FRED, Federal Reserve Bank of St Louis, on 13 November 2026. Seven Measures calculations.
Cars were 47.0 per cent of light vehicle sales on average in 2007, 27.8 per cent in 2019 and 16.8 per cent in 2025. The lowest share in the series, which begins in 1976, was 15.6 per cent in September 2025. The category that absorbed that shift is now a sixth of the market, and a seven-point rise in its share at October's total would mean selling about 45 per cent more cars.
Investment Implications
The firm reads one thing from this. The shift between body types that cushioned manufacturers and fuel demand in 2008 has little room to repeat, because the market has moved almost entirely to light trucks. Higher fuel prices now show up, if anywhere, in total volumes and in choices within the truck category rather than in the car share.
Our base case assumes gasoline stays near $4, the car share stays close to 16 per cent, and any response to fuel costs appears in total sales, which have already fallen from 16.76 million in June to 15.54 million in October. A sustained price above the May level, or a larger supply of cars, would raise the likelihood of a different path in which the share rises as it did in 2008.
What resolves it is dated. The next update to the Bureau of Economic Analysis vehicle sales series is scheduled for 25 November, and the Energy Information Administration reports retail gasoline prices every week. The work this note has not done is to split light truck sales by fuel economy, which these monthly series do not allow.