The September employment report, published on 2 October, showed payrolls up 29,000 and the unemployment rate at 4.2 per cent. Over the year to September payrolls rose 496,000, about 41,000 a month. A year earlier the unemployment rate was 4.4 per cent.
Weak hiring and a falling unemployment rate look contradictory. They are reconciled by a third number, which is rarely reported alongside either: how fast the population the labor force is drawn from is growing. That number changed this year, and it changed the payroll figure that counts as enough.
Unemployment Stopped Rising in 2026
The unemployment rate rose through 2024 and 2025 and has moved sideways since.
The Unemployment Rate, Monthly
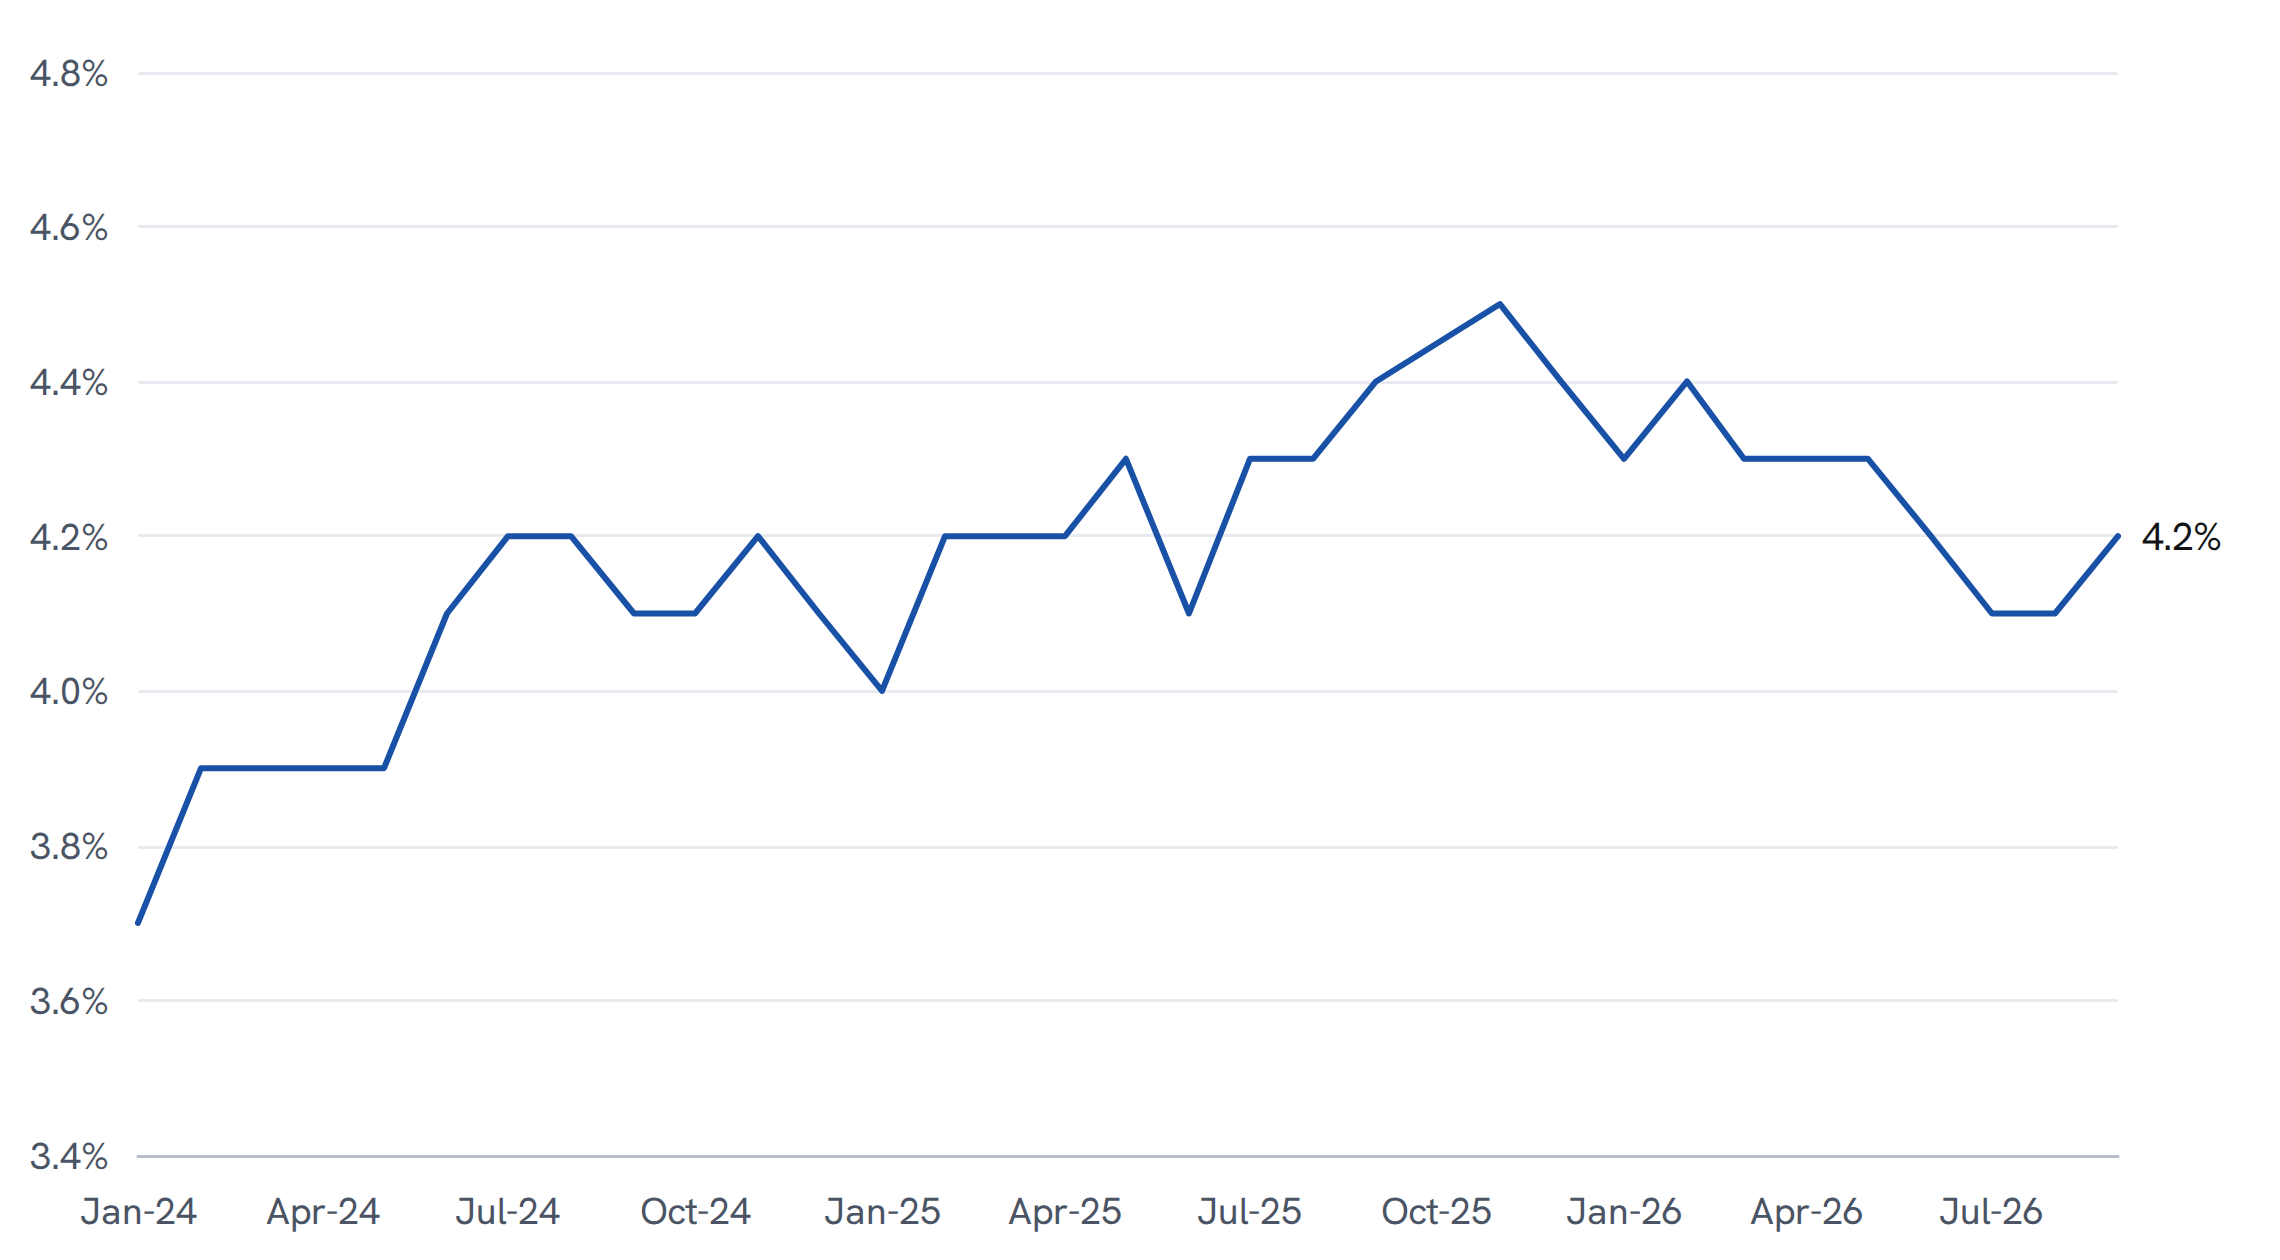
Civilian unemployment rate, per cent, seasonally adjusted, monthly from January 2024 to September 2026.
Source: U.S. Bureau of Labor Statistics, Current Population Survey, retrieved from FRED, Federal Reserve Bank of St Louis, on 9 October 2026.
No estimate is published for October 2025; the line joins September and November. The unemployment rate was not affected by the January 2026 population adjustment.
The rate was 4.0 per cent in January 2025, 4.4 per cent by September and 4.5 per cent in November. In 2026 it has not risen: 4.3 per cent in January, 4.2 per cent in September, and within 4.1 to 4.3 per cent since March, as the Bureau of Labor Statistics noted in the September release. Payroll growth did not accelerate enough to explain the difference.
The Threshold Fell by Almost Half
The household survey's estimates are controlled to the Census Bureau's estimate of the civilian noninstitutional population aged 16 and over. That population, multiplied by the share of it in the labor force, is the number of additional people looking for work each month before anyone is hired. Employment has to grow by roughly that much, less the share who are unemployed, for the unemployment rate to stay where it is.
Population, Implied Labor Force and Payrolls
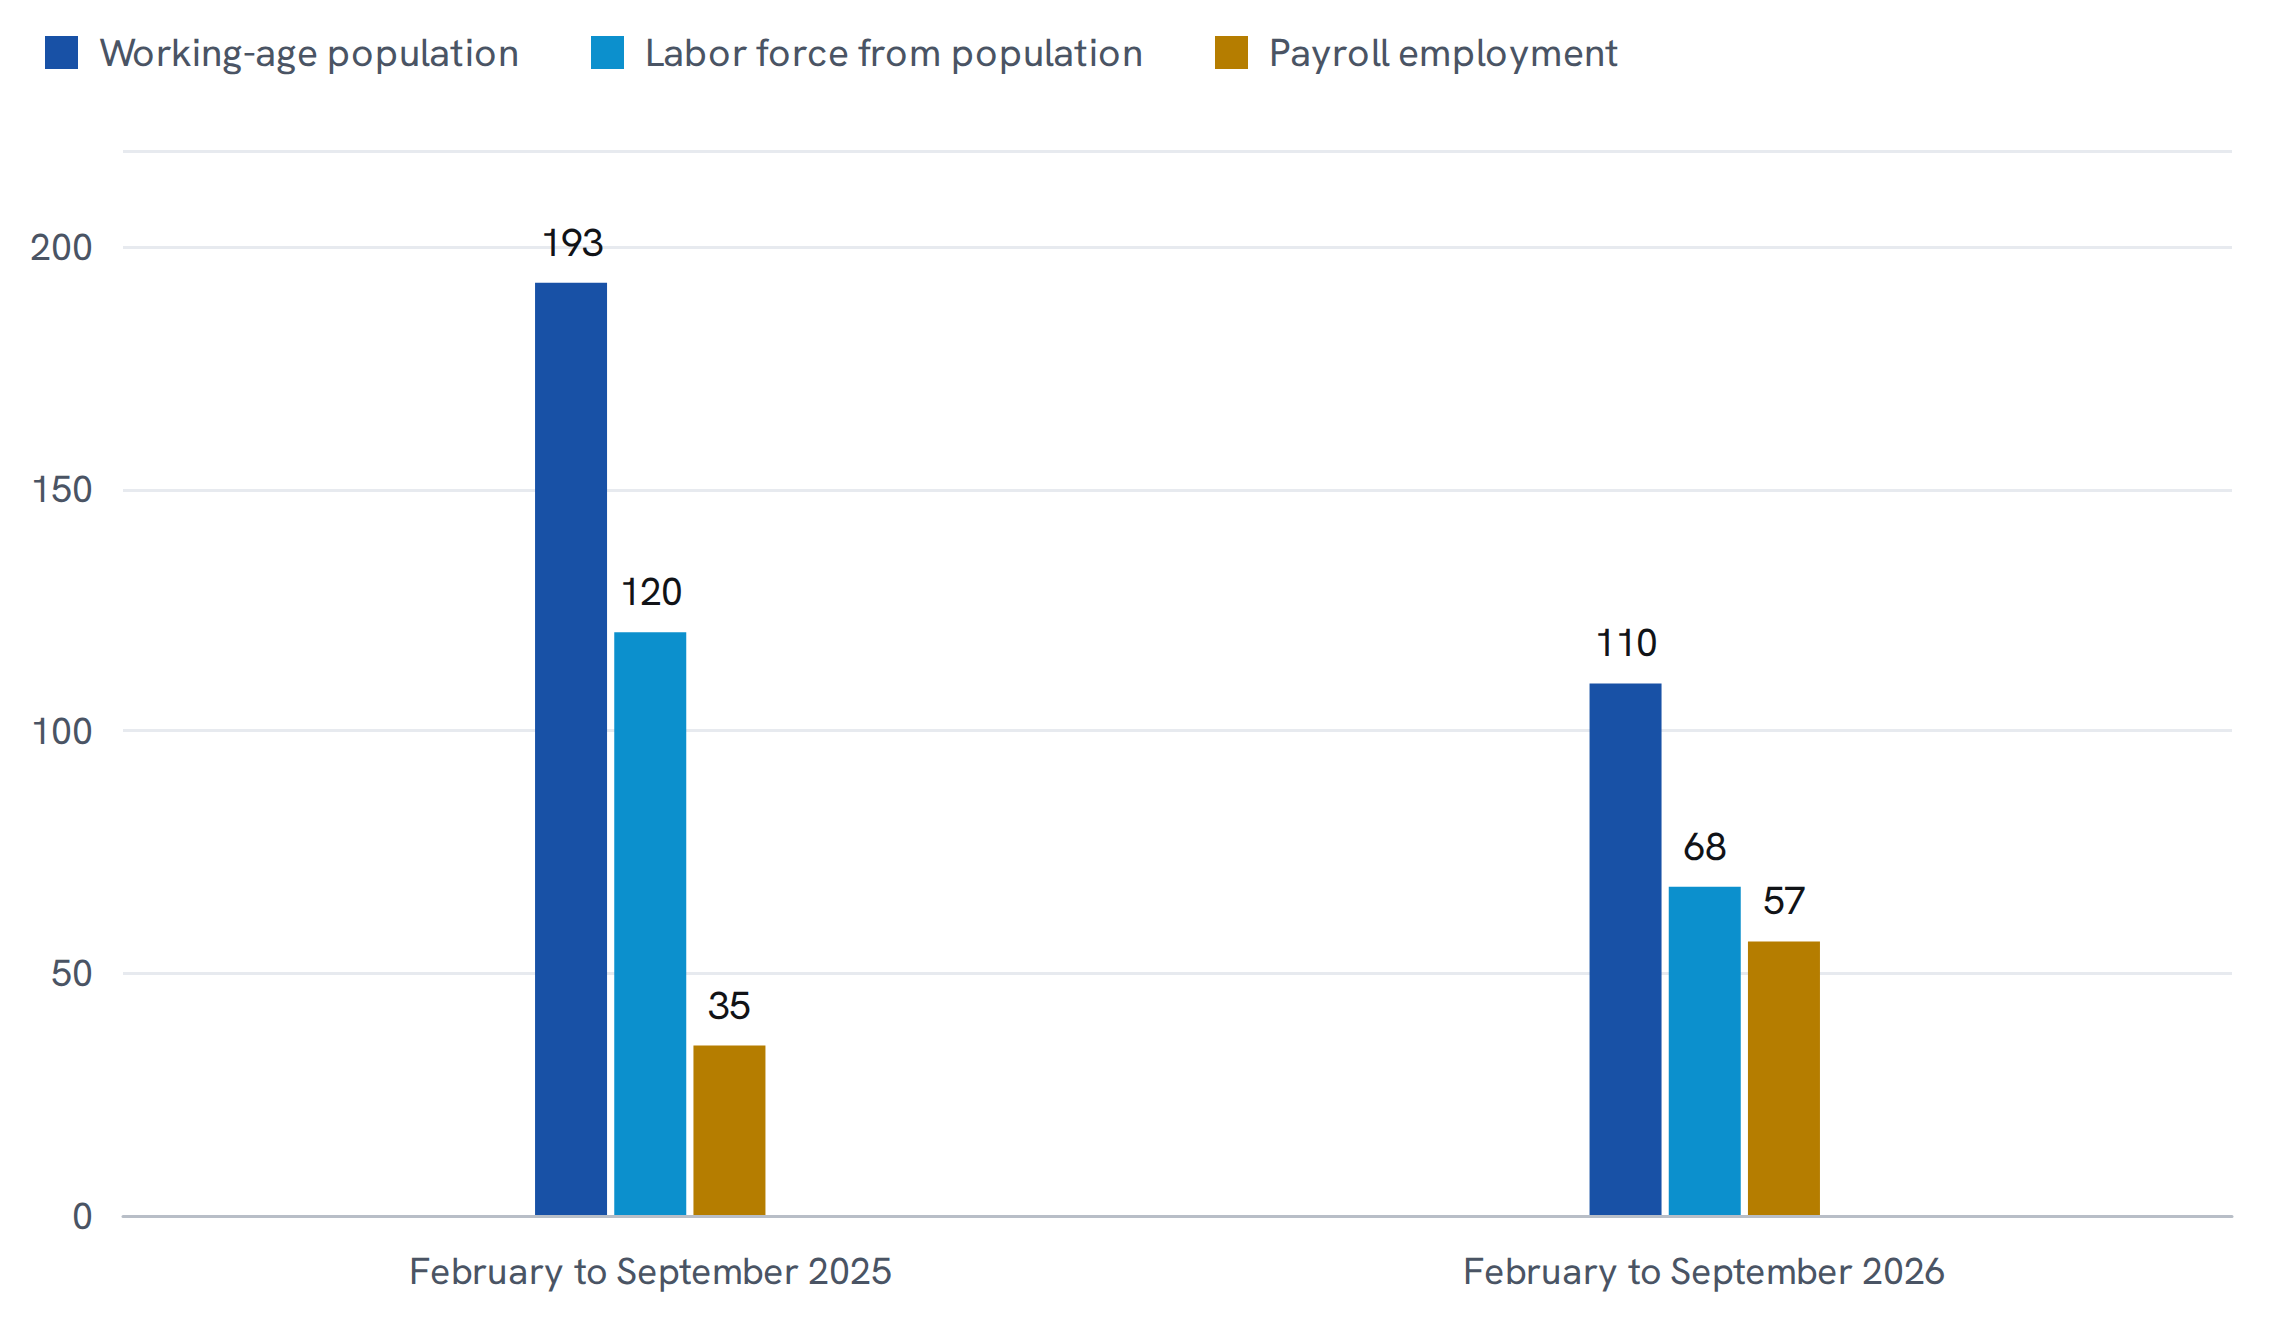
Average monthly change from February to September in 2025 and in 2026, thousands: civilian noninstitutional population aged 16 and over; that change multiplied by the labor force participation rate in September of the same year; and total nonfarm payroll employment.
Source: U.S. Bureau of Labor Statistics, Current Population Survey and Current Employment Statistics, retrieved from FRED, Federal Reserve Bank of St Louis, on 9 October 2026. Seven Measures calculations.
January is excluded from both periods because population controls are introduced with January data. The labor force column holds participation fixed at 62.5 per cent for 2025 and 61.8 per cent for 2026.
Between February and September 2025 the population grew by 193,000 a month. At a participation rate of 62.5 per cent that is 120,000 more people in the labor force each month, and with 4.4 per cent of them unemployed, about 115,000 more jobs a month to keep the rate unchanged. Payrolls grew by 35,000, and the unemployment rate rose from 4.0 to 4.4 per cent.
Over the same months of 2026 the population grew by 110,000 a month. At 61.8 per cent participation that is 68,000 more people in the labor force, and about 65,000 jobs a month to hold the rate. Payrolls grew by 57,000, and the unemployment rate moved from 4.3 to 4.2 per cent. The hiring numbers in the two years are of the same order. What changed is the number they were measured against.
The Population Update Also Moved the Levels
The slower population growth arrived with the Census Bureau's annual update, which the household survey adopted with revised January 2026 data, a month later than usual because of the 2025 federal government shutdown. The Bureau of Labor Statistics described the update as incorporating demographic detail from the 2020 Census and lower net international migration. It also reduced the estimated number of men aged 25 to 54 and raised the number of women aged 65 and over, which lowers measured participation.
Over-the-Year Changes, Reported and Adjusted
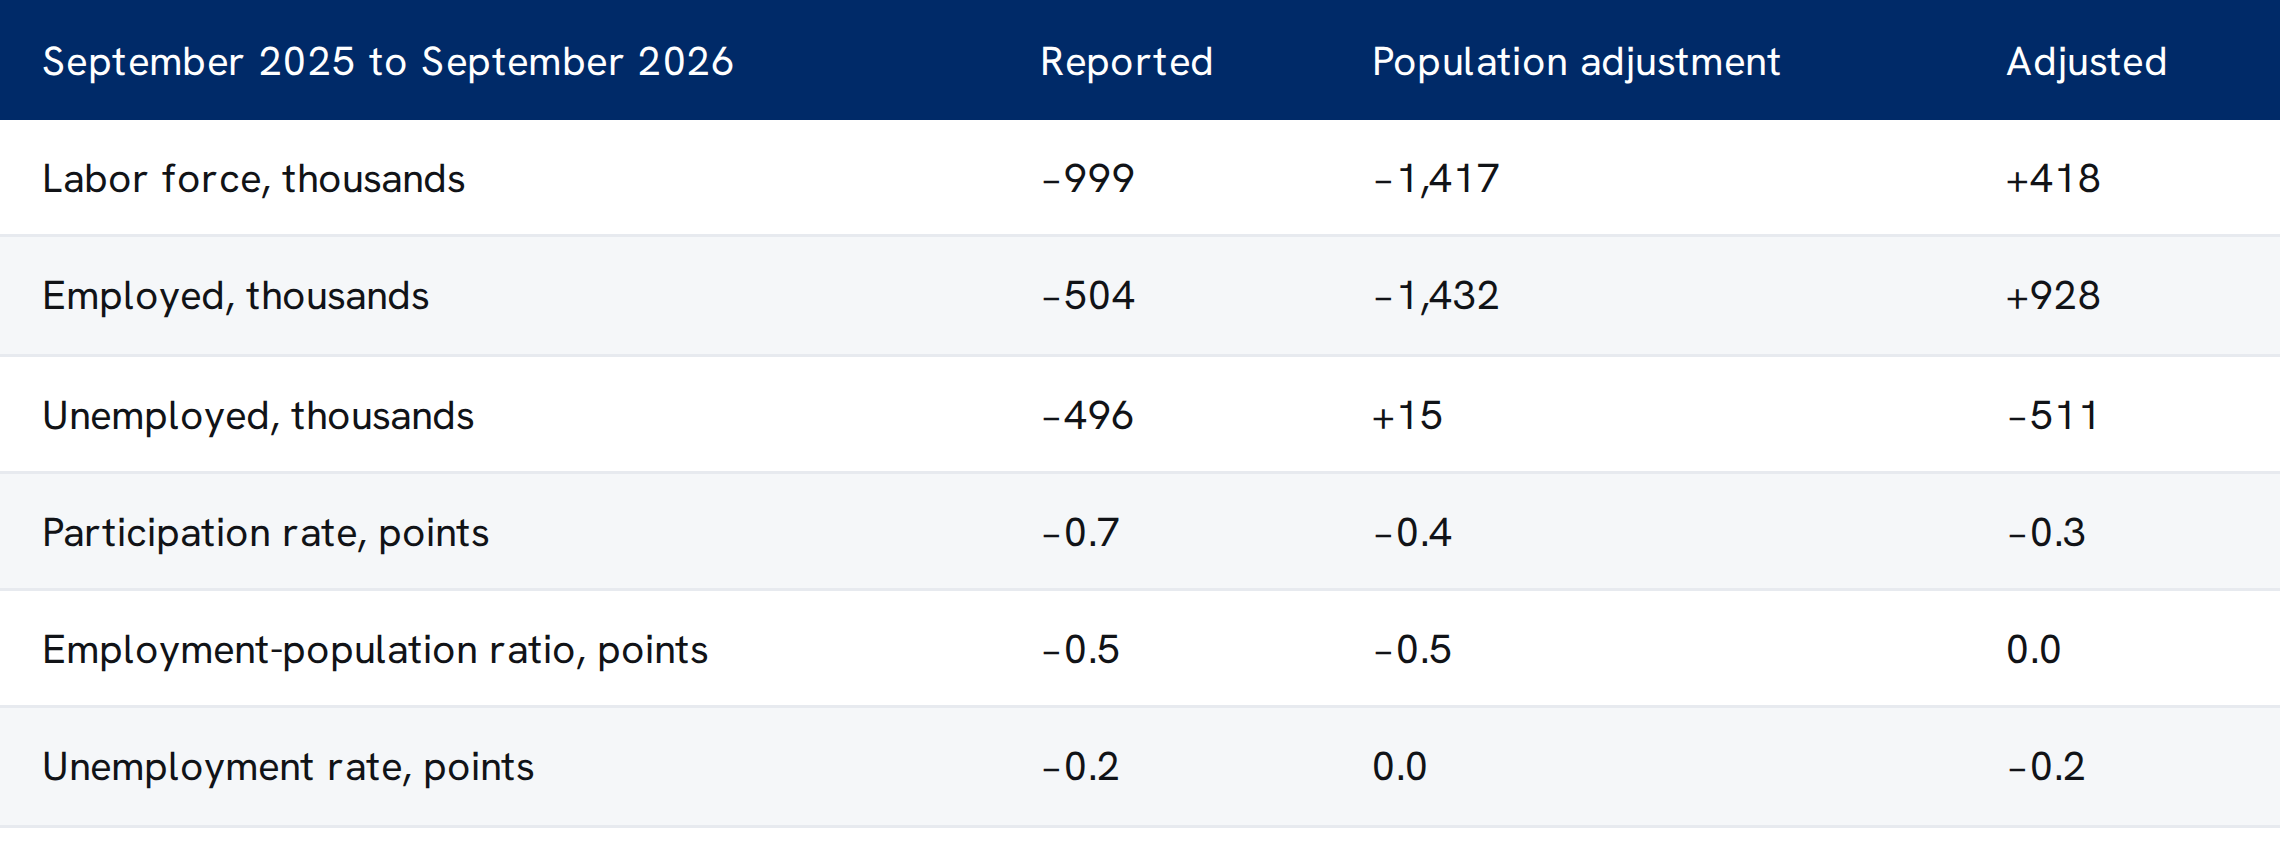
Change in household survey measures from September 2025 to September 2026, seasonally adjusted: as reported, the effect of the January 2026 population adjustment, and the change with that effect removed.
Source: U.S. Bureau of Labor Statistics, Current Population Survey, retrieved from FRED, Federal Reserve Bank of St Louis, on 9 October 2026; adjustment effects from The Employment Situation for February 2026, Table A. Seven Measures calculations.
The adjustment effects are the Bureau's estimates of the difference in December 2025, not seasonally adjusted; subtracting them from the over-the-year change follows the method the Bureau describes. The adjusted labor force, employment and unemployment changes sum to within one thousand.
As reported, the labor force fell by 999,000 over the year and employment by 504,000, which reads as people leaving work. The adjustment alone removed 1,417,000 from the labor force and 1,432,000 from employment. With it taken out, the labor force rose by 418,000, employment by 928,000 and unemployment fell by 511,000. Participation fell 0.3 points rather than 0.7, and the employment-to-population ratio was unchanged. The reported decline in participation is mostly a change in who the survey estimates the population to be, not a change in what they are doing.
Investment Implications
The firm reads one thing from this. A monthly payroll figure is judged against a benchmark, and the benchmark has roughly halved. At the population growth now embedded in the survey, gains of about 65,000 a month are consistent with a steady unemployment rate. A print in the tens of thousands that would have signalled rising slack in 2025 does not, on this arithmetic, signal it in 2026.
The Federal Open Market Committee appears to read it the same way. Its statement of 16 September, which raised the target range to 3¾ to 4 per cent, said that “job gains have kept pace with the workforce, and the unemployment rate has changed little.” A slower-growing workforce is a lower bar to keep pace with. Our base case assumes the population estimate keeps growing near its current pace and participation drifts down slowly with age, so payroll gains in the range of recent months are compatible with an unemployment rate close to where it is. A further downward revision to migration, or a faster fall in participation, would lower the threshold again; a sustained run of payroll gains well below it, with the unemployment rate rising, would raise the likelihood that the labor market is softening rather than shrinking.
What resolves it is dated. Each monthly report gives the unemployment rate the threshold is meant to explain, and the next population update arrives with January 2027 data. The work this note has not done is to split the slower population growth between its migration and demographic components, which the Census Bureau's own estimates would allow.