Carnival filed its quarterly report for the three months to 31 August on 29 September. Net income was $1,923m, up from $1,854m a year earlier, and diluted earnings per share rose from $1.33 to $1.40. Operating income, the line that measures the ships, fell from $2,271m to $2,220m.
The two lines moved in opposite directions because the improvement came from below operating income. Carnival's debt has fallen at every fiscal year end since 2022, and its interest bill has fallen with it. This quarter the fuel bill grew by more than the interest bill shrank. This note sets the two against each other, from the company's own statements and the price of crude.
Operating Income Fell While Earnings Rose
Every line of the income statement is reported, so the change in net income can be bridged from the filing alone.
From Last Year's Third Quarter to This One
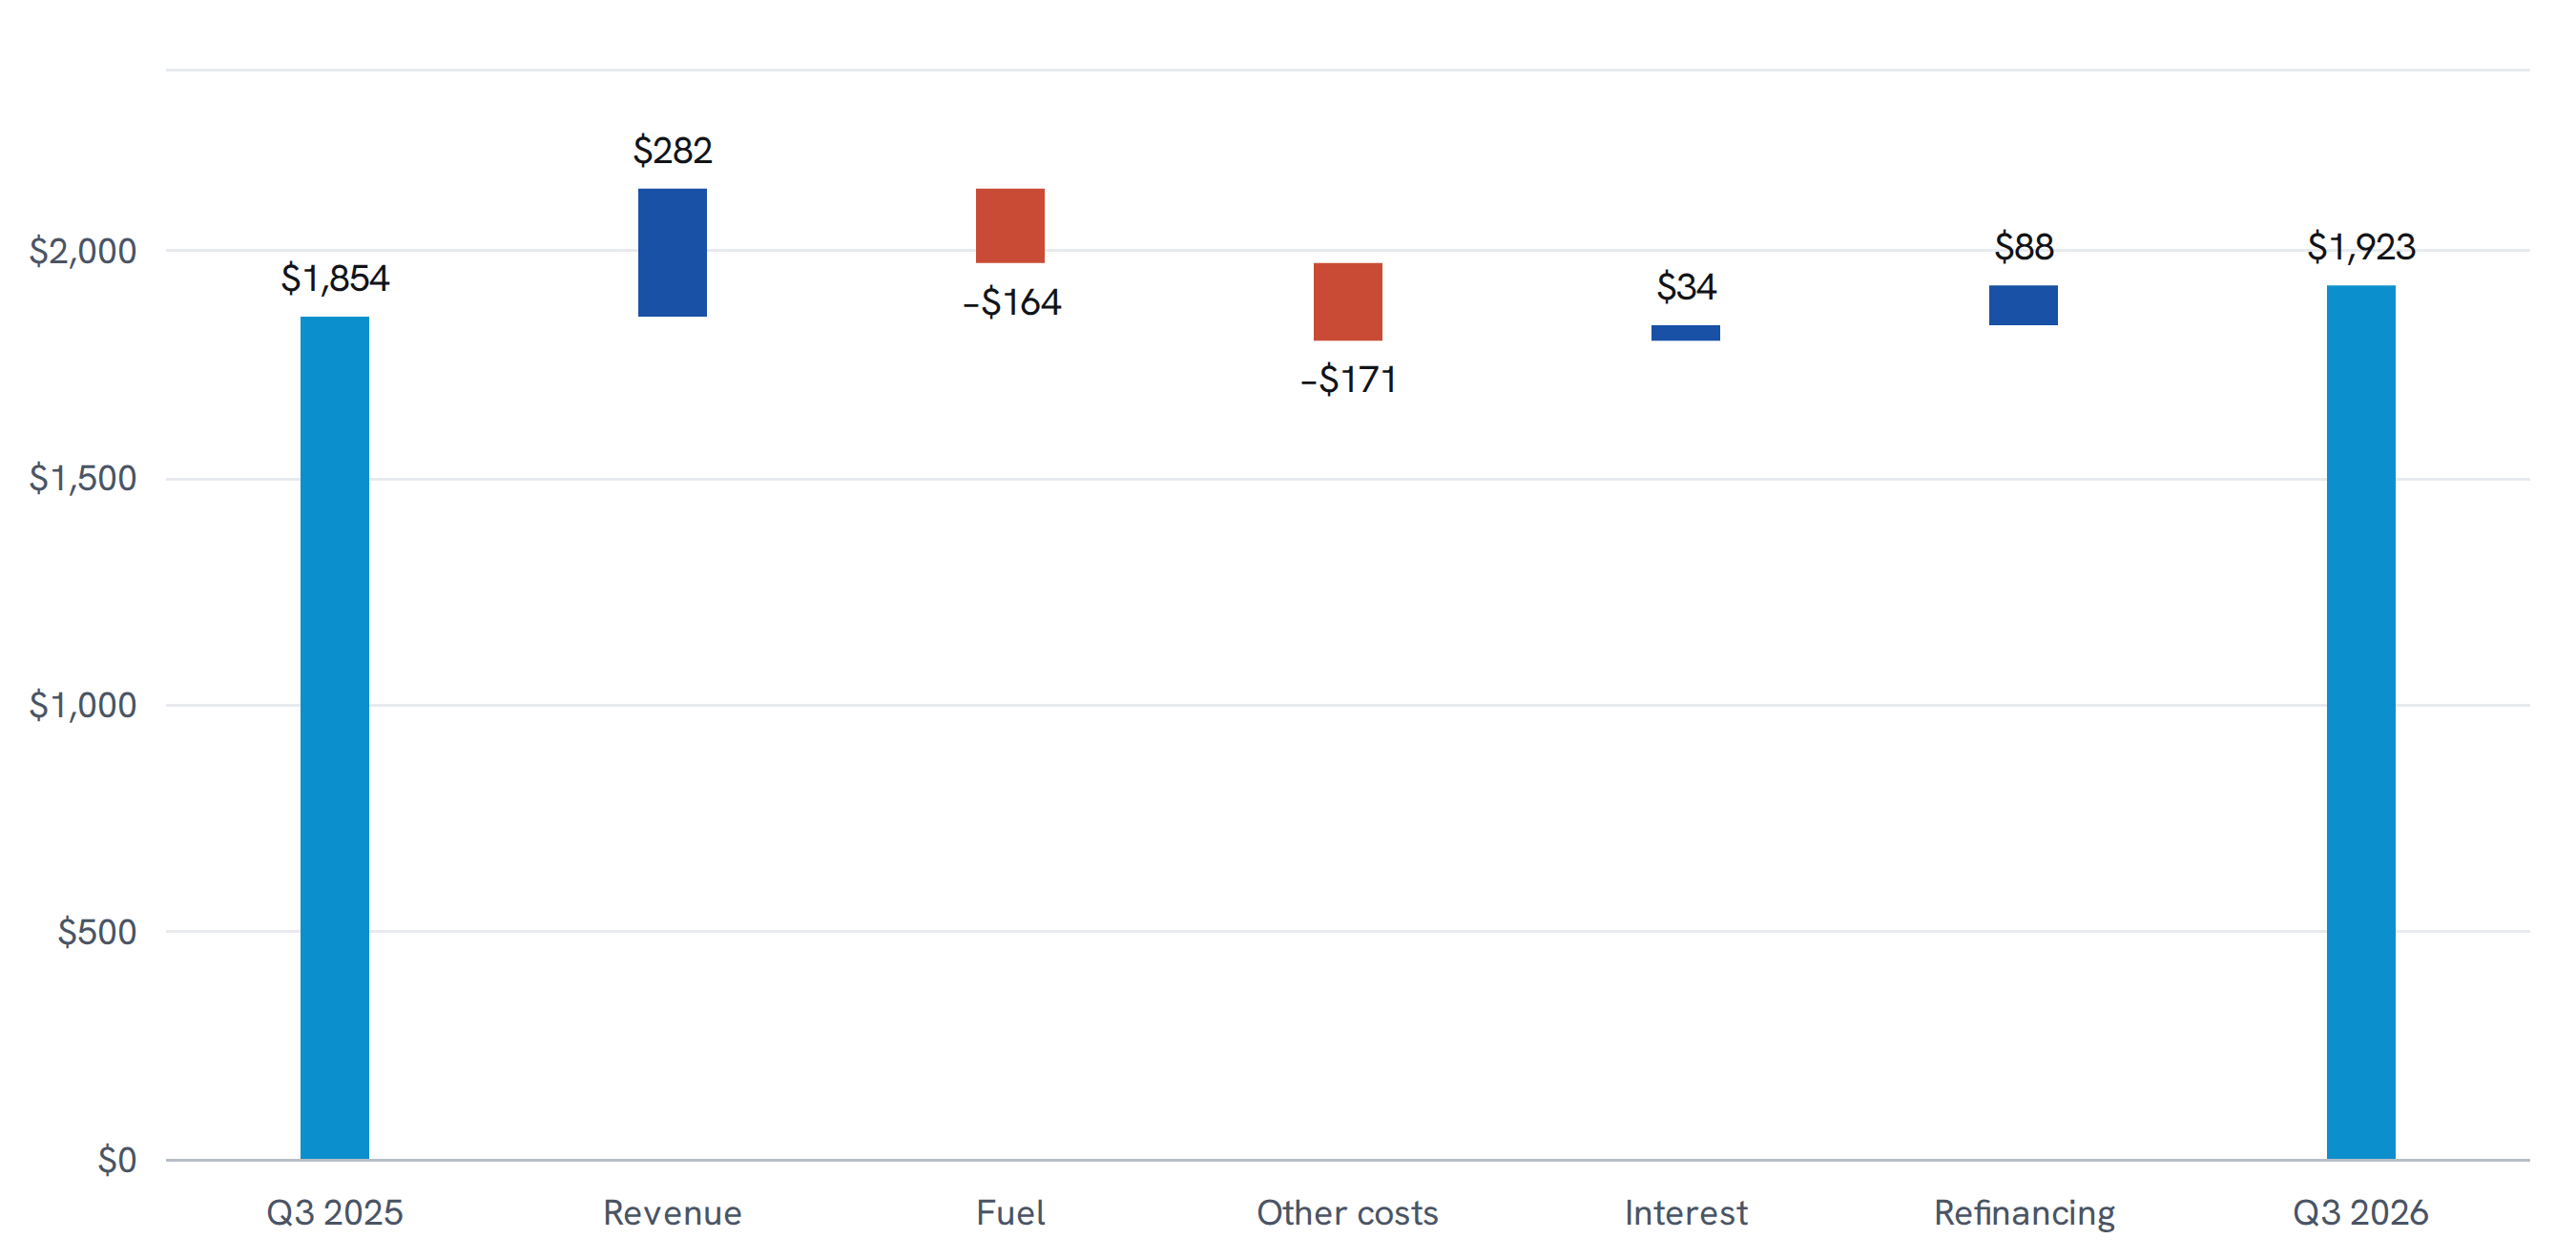
Change in net income between the three months to 31 August 2025 and the three months to 31 August 2026, $m, by income statement line.
Source: Carnival Corporation Ltd., Form 10-Q for the quarter ended 31 August 2026, filed with the SEC on 29 September 2026. Seven Measures calculations.
Other costs are every cruise operating expense other than fuel, plus selling and administrative expense and depreciation. Interest is interest income less interest expense. Refinancing is debt extinguishment and modification costs. Other income rose $10m and tax rose $10m, which offset and are not shown. The steps sum exactly to the reported change in net income; reported subtotals carry rounding of up to $2m.
Revenue rose $282m. Fuel took $164m of it, 58 per cent, and the rest of the cost base took $171m, so operating income fell $51m. Below that line, interest income rose $2m and interest expense fell $32m, a net gain of $34m. The larger contribution was the debt extinguishment charge: $111m a year ago, when Carnival refinanced, and $23m this quarter.
That charge is the cost of retiring debt early. It is real, but it falls when the company refinances rather than every quarter. Excluding it from both years, income before tax was $1,962m against $1,971m, $9m lower on $282m more revenue.
The Fuel Bill Is a Price, Not a Volume
The filing attributes the $243m rise in cruise operating expenses to three things: $149m from higher fuel prices, $70m from a 1.5 per cent increase in capacity, and $26m from emissions allowances. Those sum to $245m, the remainder being the filing's own rounding. Fuel price alone is larger than either revenue driver the filing names for ticket sales: $80m from capacity and $36m from higher ticket prices.
Brent Crude, Daily
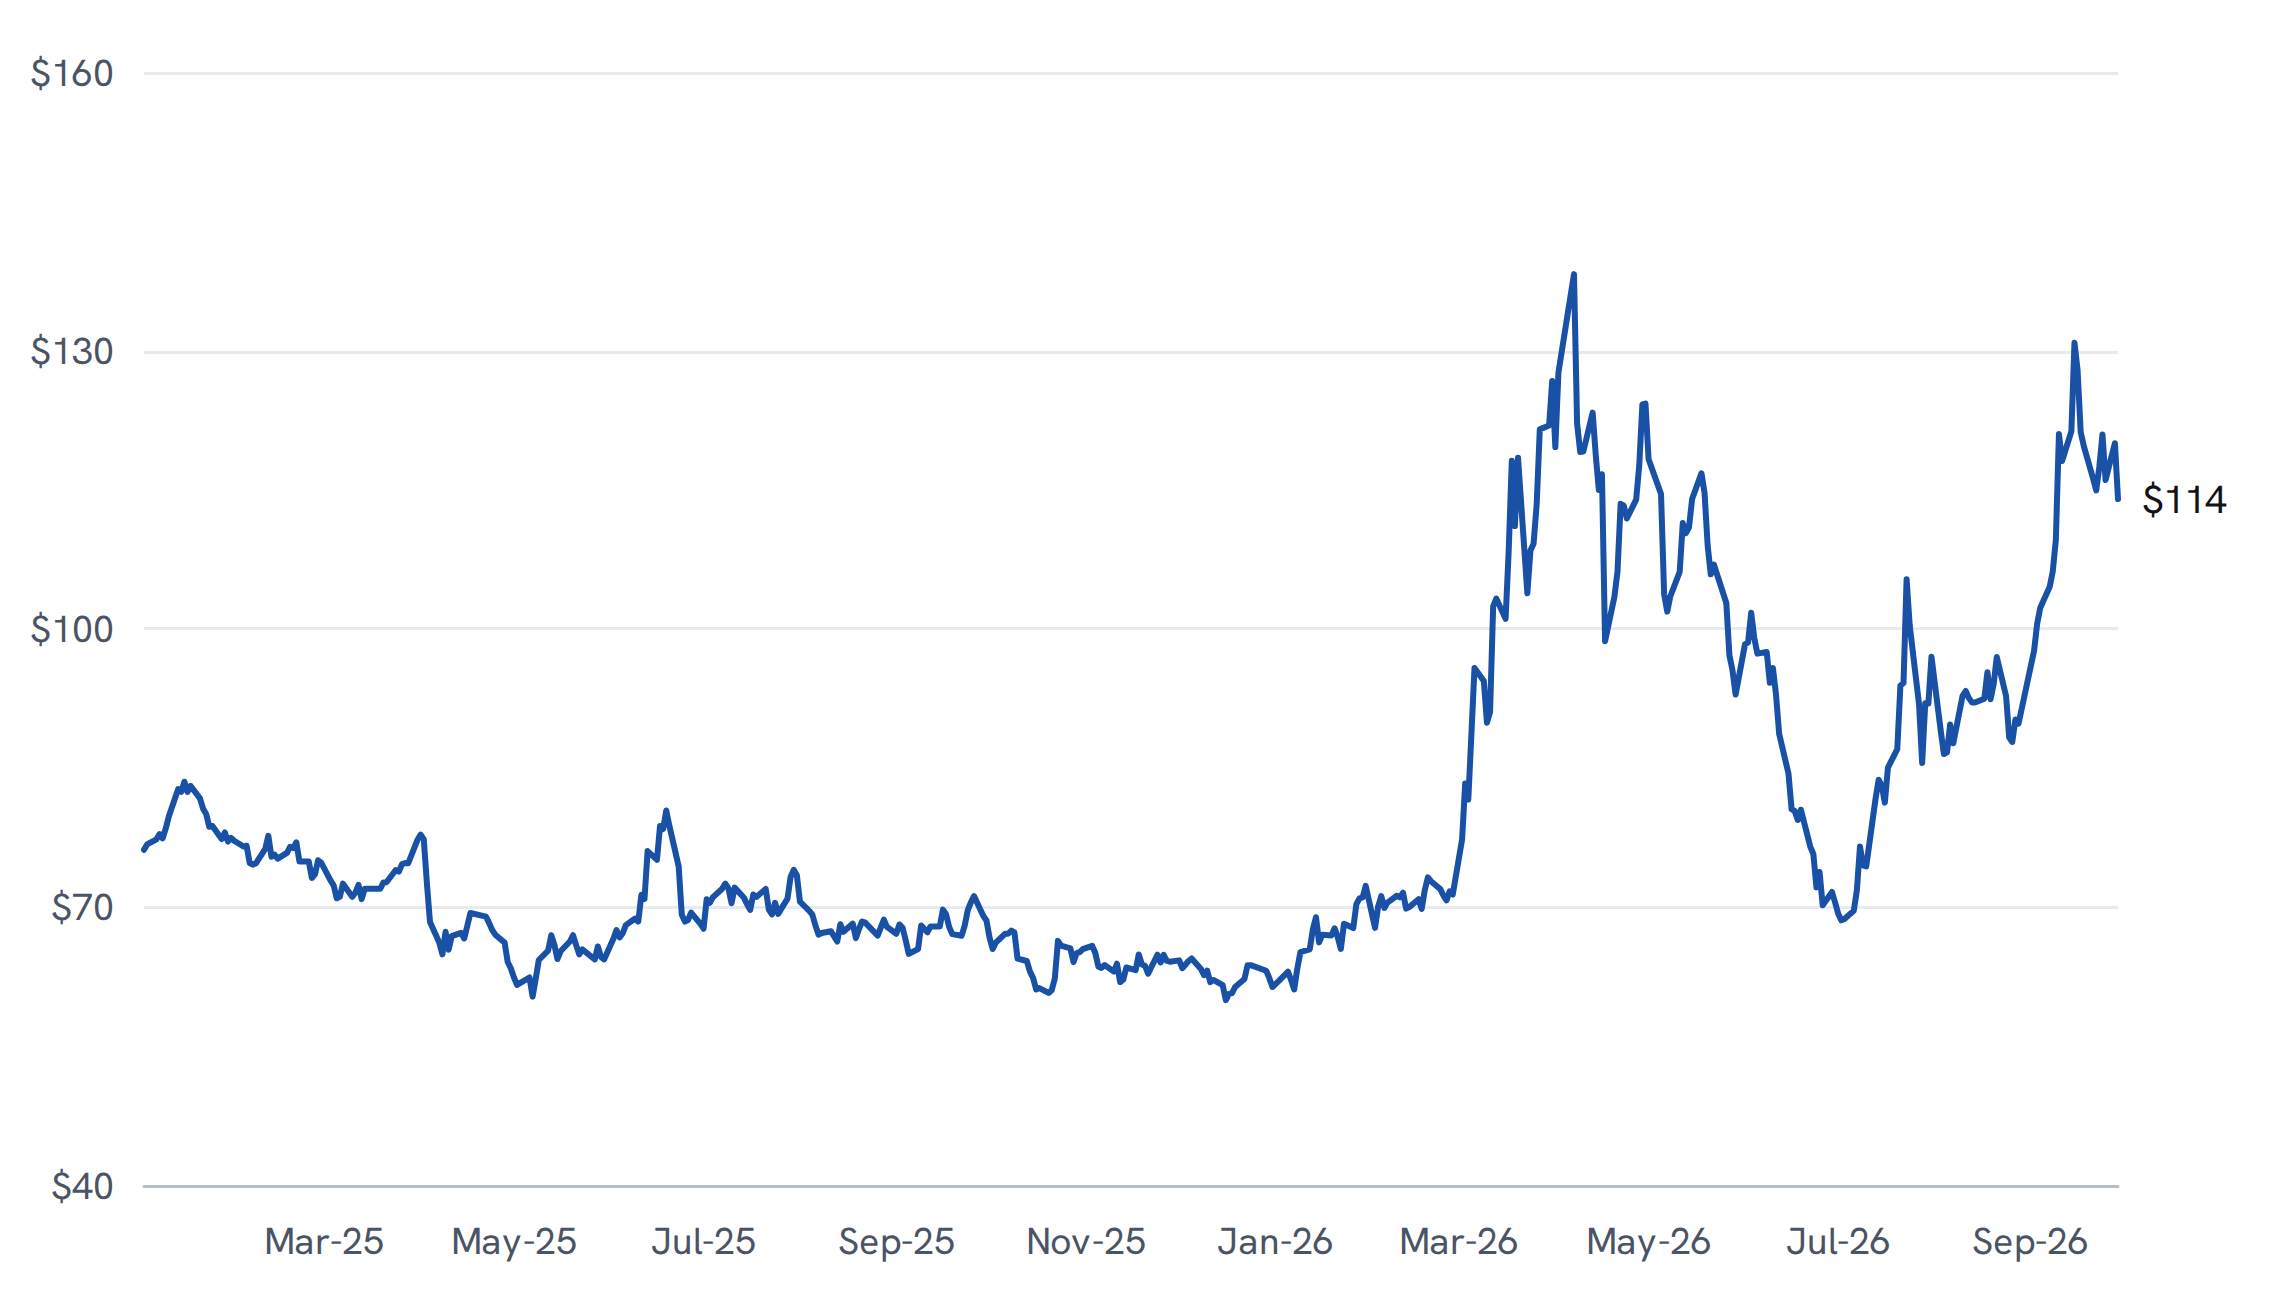
Brent crude oil spot price, $ per barrel, daily, 2 January 2025 to 29 September 2026.
Source: U.S. Energy Information Administration, Brent crude oil spot price (DCOILBRENTEU), retrieved from FRED, Federal Reserve Bank of St Louis, on 2 October 2026.
Fuel Price, Fuel Use and Crude
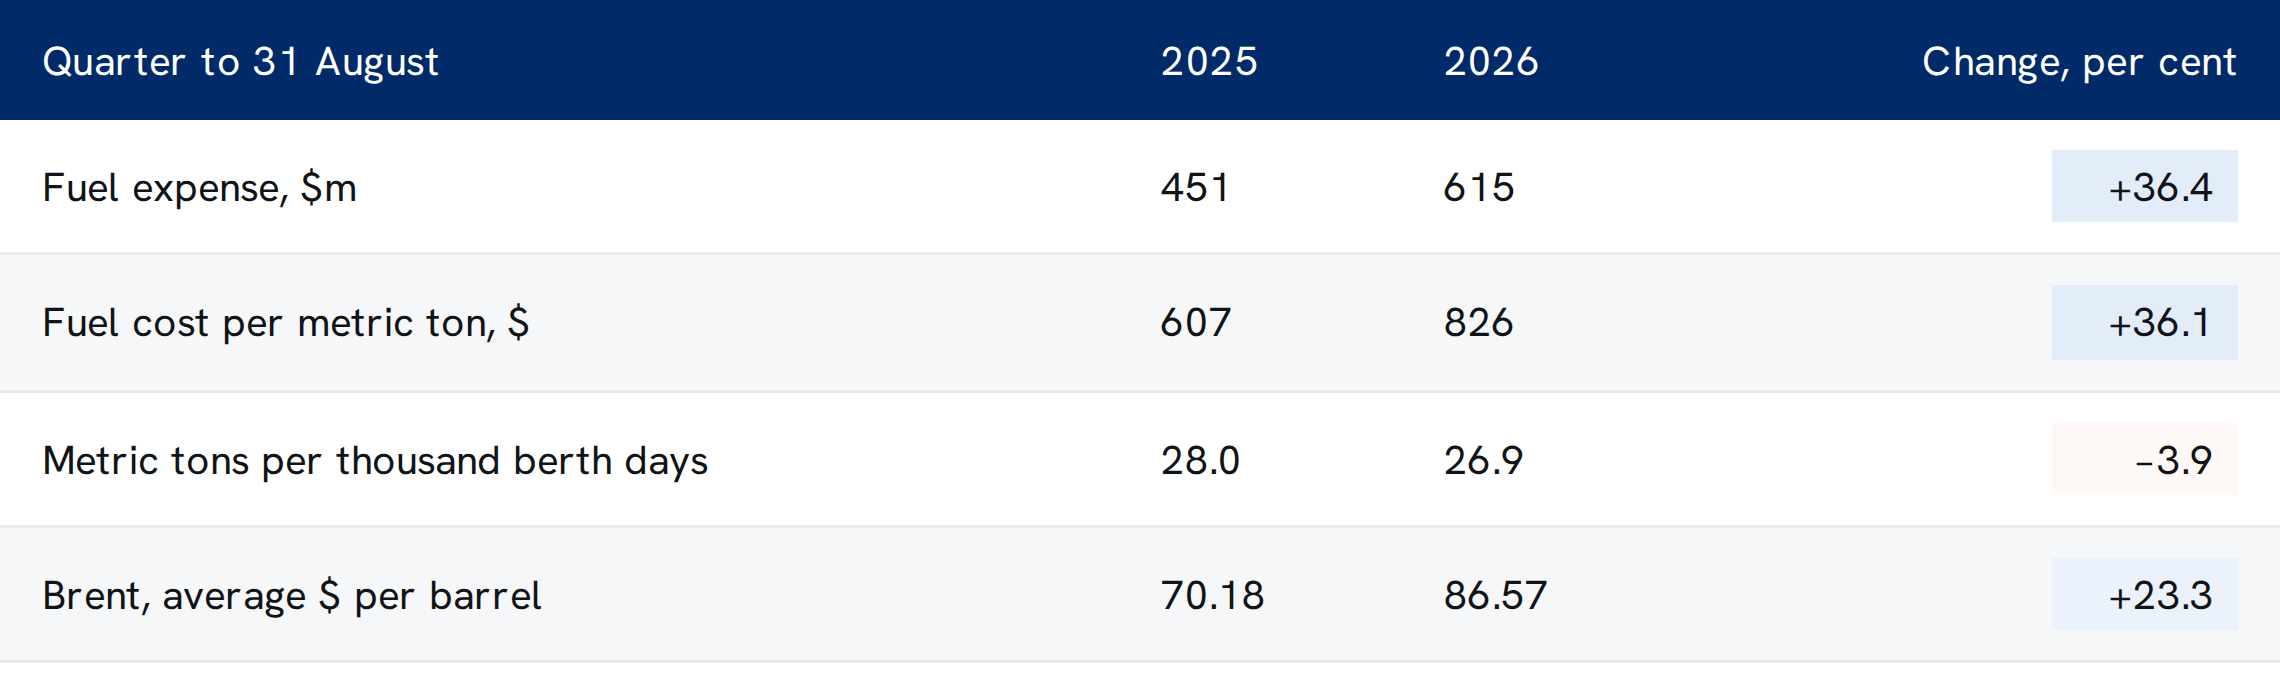
Fuel expense, fuel cost per metric ton consumed and fuel consumed per thousand available lower berth days, three months to 31 August 2025 and 2026; Brent spot price averaged over trading days from 1 June to 31 August in each year.
Source: Carnival Corporation Ltd., Form 10-Q for the quarter ended 31 August 2026, filed 29 September 2026; U.S. Energy Information Administration, Brent crude oil spot price, retrieved from FRED, Federal Reserve Bank of St Louis, on 2 October 2026. Seven Measures calculations.
Fuel cost per metric ton excludes emissions allowances, as the filing reports it. Fuel expense includes them. Brent is shown for its direction; the ships burn marine fuels whose prices follow crude but are not the same product.
Carnival used 3.9 per cent less fuel per berth day than a year earlier and paid 36.1 per cent more for each ton, so the bill rose 36.4 per cent. Brent rose 23.3 per cent between the same months. The filing describes its approach to fuel price risk as managing consumption, through fleet optimisation, efficiency and itineraries, and describes no fuel derivative, so the price passes into the income statement as fuel is bought.
Emissions add a second layer. Carnival became subject to the EU Emissions Trading System in 2024 under a three-year phase-in. The filing puts the cost at $91m in 2025, covering 70 per cent of in-scope emissions, and expects about $160m in 2026, when all in-scope emissions are covered.
The Interest Saving Is Steady but Smaller
The interest line falls because the debt does. Total debt, the current portion and long-term debt together, has come down every year since the end of fiscal 2022.
Total Debt at Each Quarter End
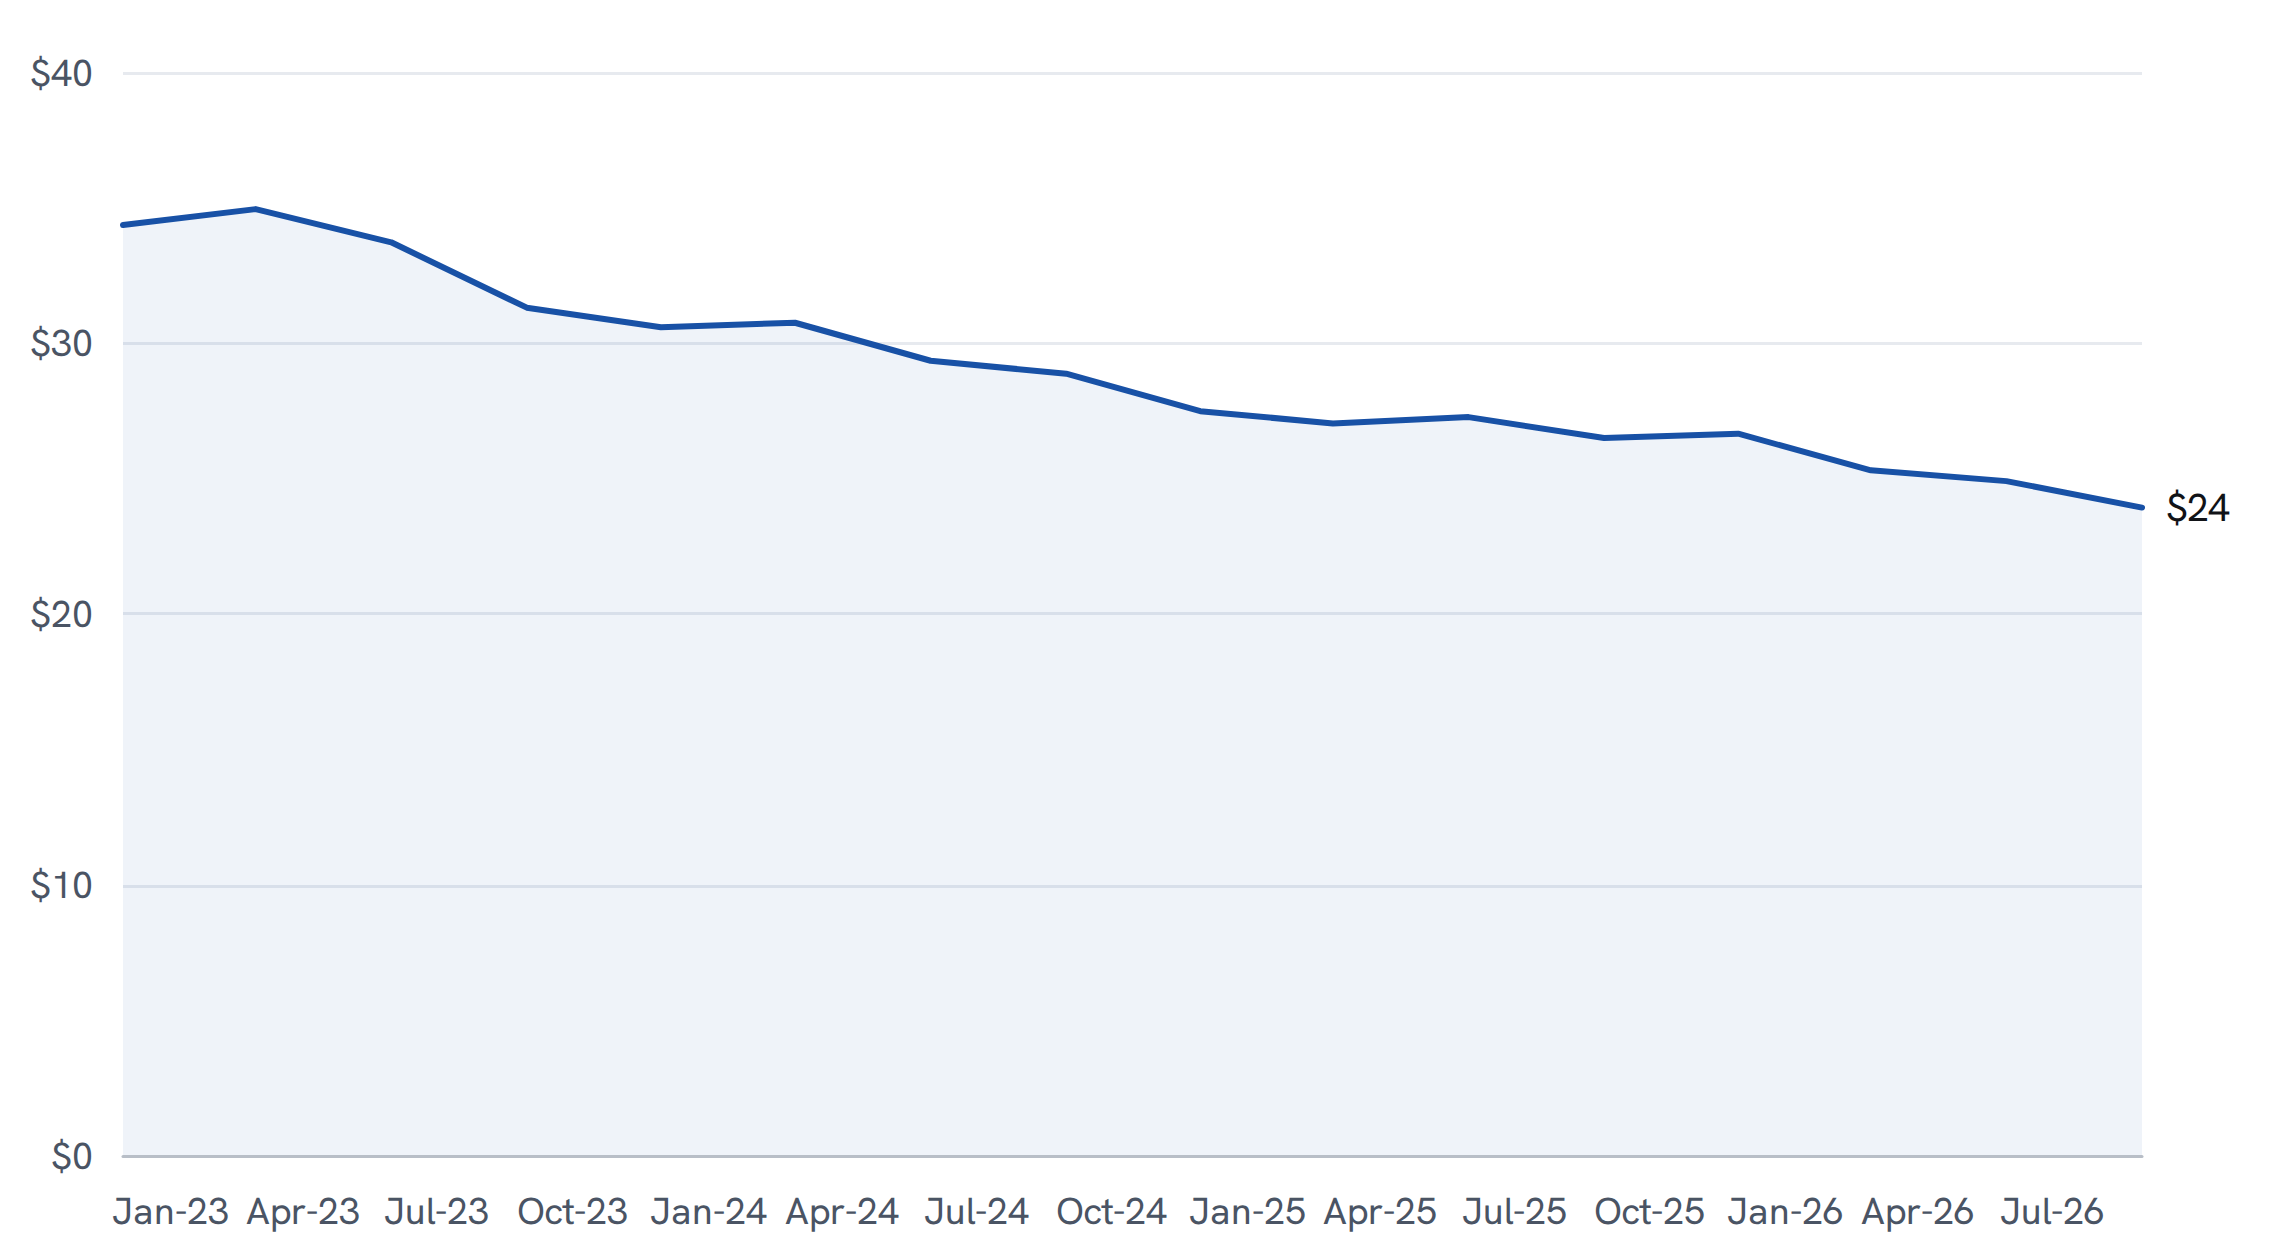
Current portion of long-term debt plus long-term debt, $bn, at each fiscal quarter end from 30 November 2022 to 31 August 2026.
Source: Carnival Corporation Ltd. and predecessor registrant filings on Forms 10-Q and 10-K, XBRL financial data retrieved from SEC EDGAR on 2 October 2026. Seven Measures calculations.
At 31 August 2026 the two lines were $2,036m and $21,876m, which sum to the $23,912m shown.
Debt was $34,346m at the end of November 2022 and $23,912m at the end of August 2026, a reduction of $10,434m, or 30.4 per cent. Over the last twelve months it fell $2,569m. The filing attributes this quarter's lower interest expense to the smaller balance, partly offset by less interest capitalised on ships under construction.
The two sides can be compared over a longer window than one quarter. Over the nine months to August, interest expense fell $172m and fuel expense rose $223m. The deleveraging is producing a saving, and the fuel bill has outgrown it.
Investment Implications
The firm reads two things from this. The first is that earnings per share is the widely followed number and operating income is the one that measures the business, and this quarter they disagreed. The increase in earnings came from a smaller refinancing charge and a lower interest bill. The ships earned less than a year ago on more revenue, because fuel, against which the filing describes no financial hedge, rose faster than ticket prices.
The second is that the balance between those two forces has turned. Deleveraging produces a saving that grows slowly and predictably as debt is repaid. Fuel moves with crude. In the fourth fiscal quarter of 2025, from September to November, Brent averaged $65.48. In September 2026, through the 29th, it averaged $114.08. Our base case assumes Carnival's fuel cost per ton continues to follow crude with a lag, so that fourth-quarter fuel expense rises year on year by more than interest expense falls, and the emissions charge rises with the move to full coverage. A return in Brent towards the $70 range of last autumn would raise the likelihood of a different path, as would a refinancing that lowers the interest bill faster than repayment alone.
What resolves it is dated. The annual report for the year to 30 November will give full-year fuel and interest expense, from which the fourth quarter can be derived. The work this note has not done, and which would sharpen it, is to measure how many weeks separate a move in crude from a move in Carnival's reported fuel cost per ton.