The Census Bureau's construction spending release of 1 September put private manufacturing construction at a $167.8bn annual rate in July, a third below the $249.1bn it reached in September 2024. The factory building that began in 2022 is unwinding, and four and a half years is long enough to ask what it added.
Between January 2022 and July 2026 private construction put in place on manufacturing plant came to $884bn, or $674bn measured in the prices of 2021. Over the same months the Federal Reserve's index of manufacturing capacity rose 3.7 per cent, manufacturing output rose 0.2 per cent, and capacity utilisation fell 2.7 points to 75.7. This note reads those two series against each other, and the subsector detail in both, to establish where the capacity that did appear came from.
The Boom Has Given Back Half Its Rise
Manufacturing construction is the one category of American building that industrial policy set out to move, and it moved further than any other. The monthly series is published at an annual rate, so the level is directly comparable through the cycle.
Two and a Half Times the Pre-2022 Rate, and Falling
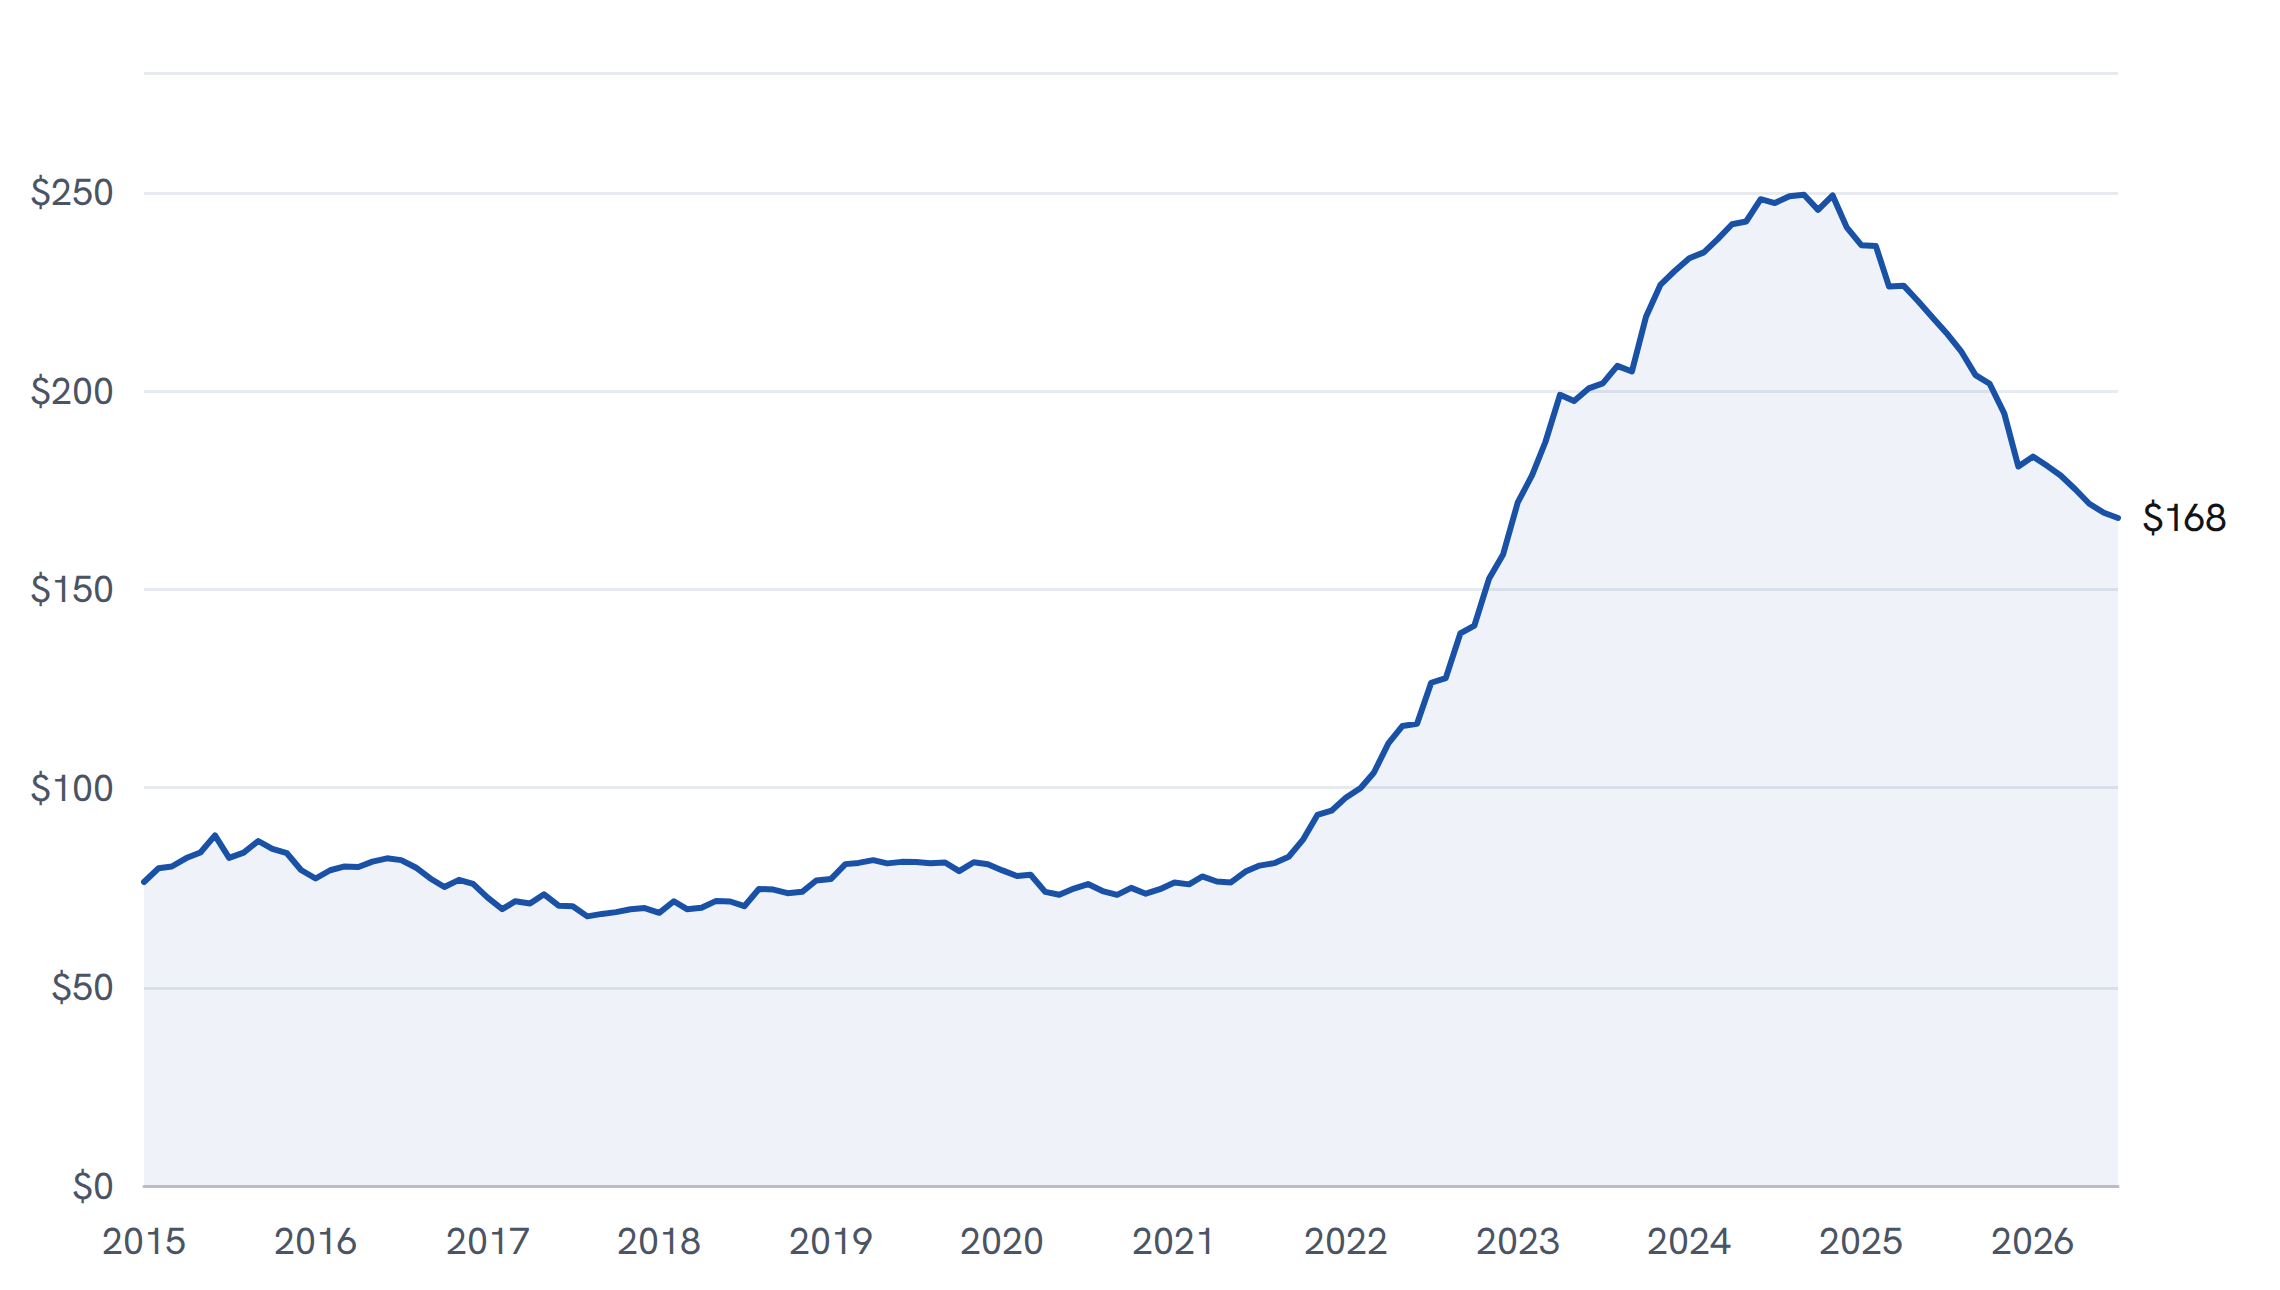
Value of private construction put in place on manufacturing structures, United States, $bn at a seasonally adjusted annual rate, monthly from January 2015 to July 2026.
Source: U.S. Census Bureau, Value of Private Construction Put in Place, Construction Spending release of 1 September 2026, retrieved 25 September 2026.
July 2026 is a preliminary estimate and May and June are revised. Public manufacturing construction, which is excluded, was between 0.5 and 1.2 per cent of the total across the period.
The series did not exceed $95bn in any month of the seven years to the end of 2021, and its low was $67.6bn in August 2017. It then rose from $94.2bn in December 2021 to $249.1bn in September 2024, and has given back $81.3bn of that $155.0bn rise since. What is left is still 78 per cent above where it started, so this is a boom coming off its peak rather than one that has ended.
Ninety Per Cent of the Decline Is One Category
Census publishes manufacturing construction by subsector, and the aggregate turns out to be carrying a single one of them. Computer, electronic and electrical plant was 23.4 per cent of manufacturing construction in December 2021. At the September 2024 peak it was 50.1 per cent.
The Fall From the Peak, by Subsector
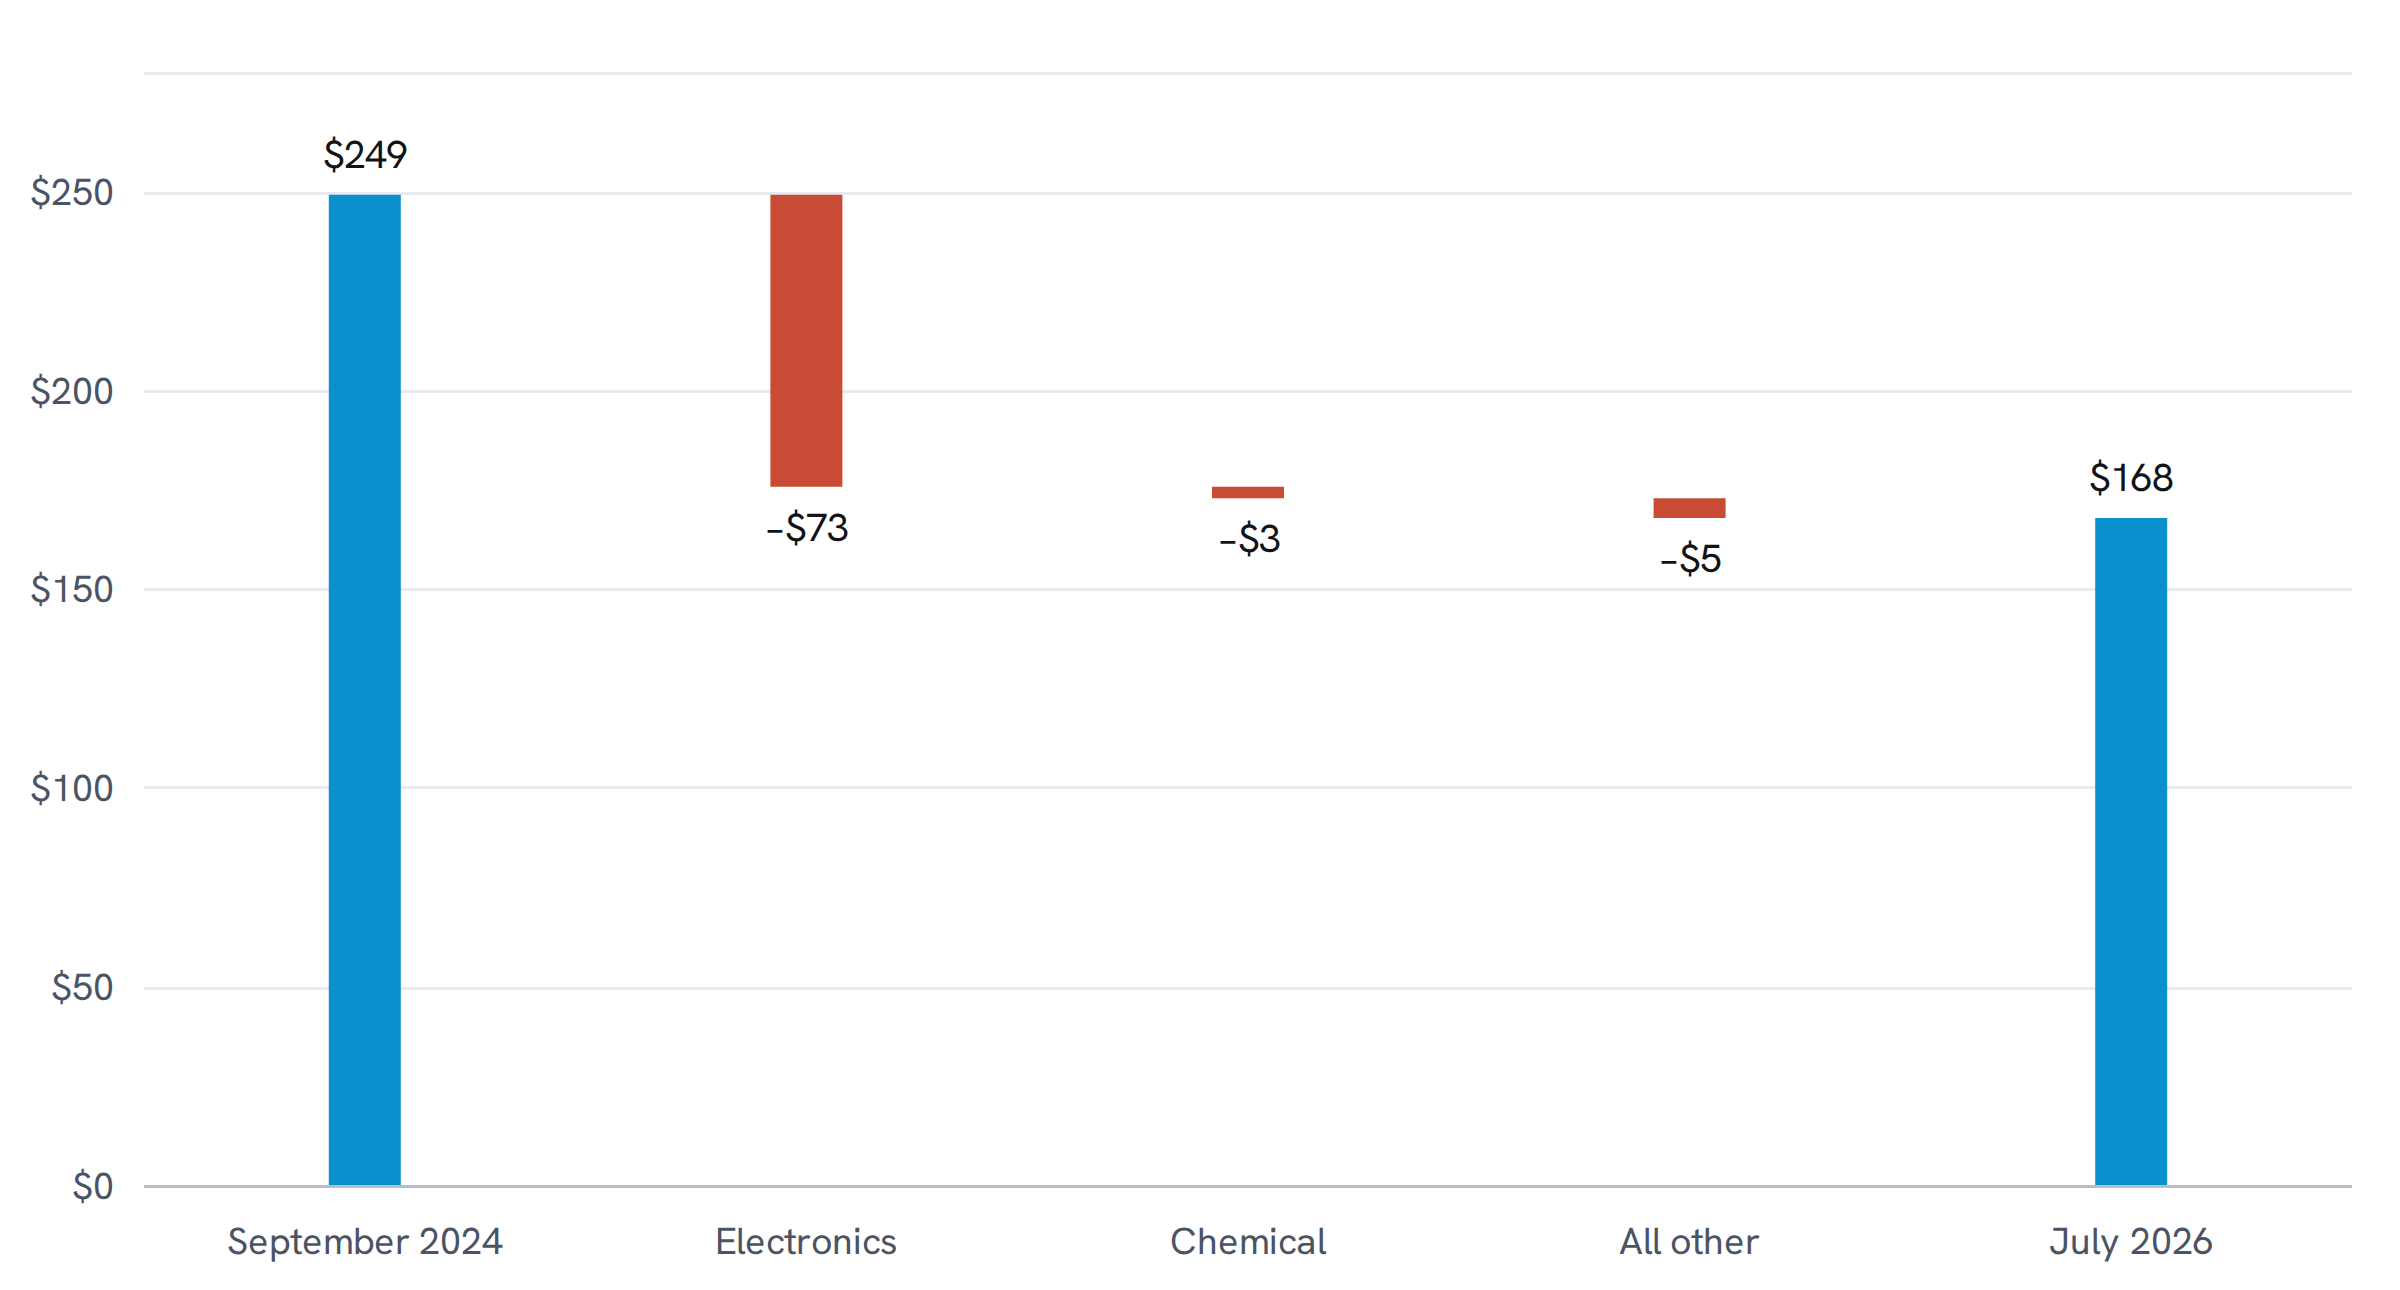
Change in the value of private construction put in place on manufacturing structures between September 2024 and July 2026, $bn at a seasonally adjusted annual rate, by subsector.
Source: U.S. Census Bureau, Value of Private Construction Put in Place, Construction Spending release of 1 September 2026, retrieved 25 September 2026.
Electronics is the Census category computer, electronic and electrical. All other combines every remaining manufacturing subsector, including those Census does not publish separately, and is computed as the residual against the published manufacturing total.
Of the $81.3bn the aggregate has lost since September 2024, $73.5bn is that one category, $2.9bn is chemical plant and $5.0bn is everything else combined. Measured year on year the concentration is starker still: manufacturing construction is $46.5bn lower than in July 2025, and $45.4bn of that, or 97.5 per cent, is computer, electronic and electrical. The same category supplied 66.3 per cent of the rise to the peak. What is unwinding is not the factory boom in general but the semiconductor and electronics part of it, and the other subsectors are close to flat in both directions.
What Reached the Capacity Index
Spending is a flow into a building site. Capacity is what the Federal Reserve judges a plant can sustainably produce, and it counts a line only once that line can run. The two series are published independently and can be set against each other on a common base.
Capacity Moved a Tenth as Far as the Money
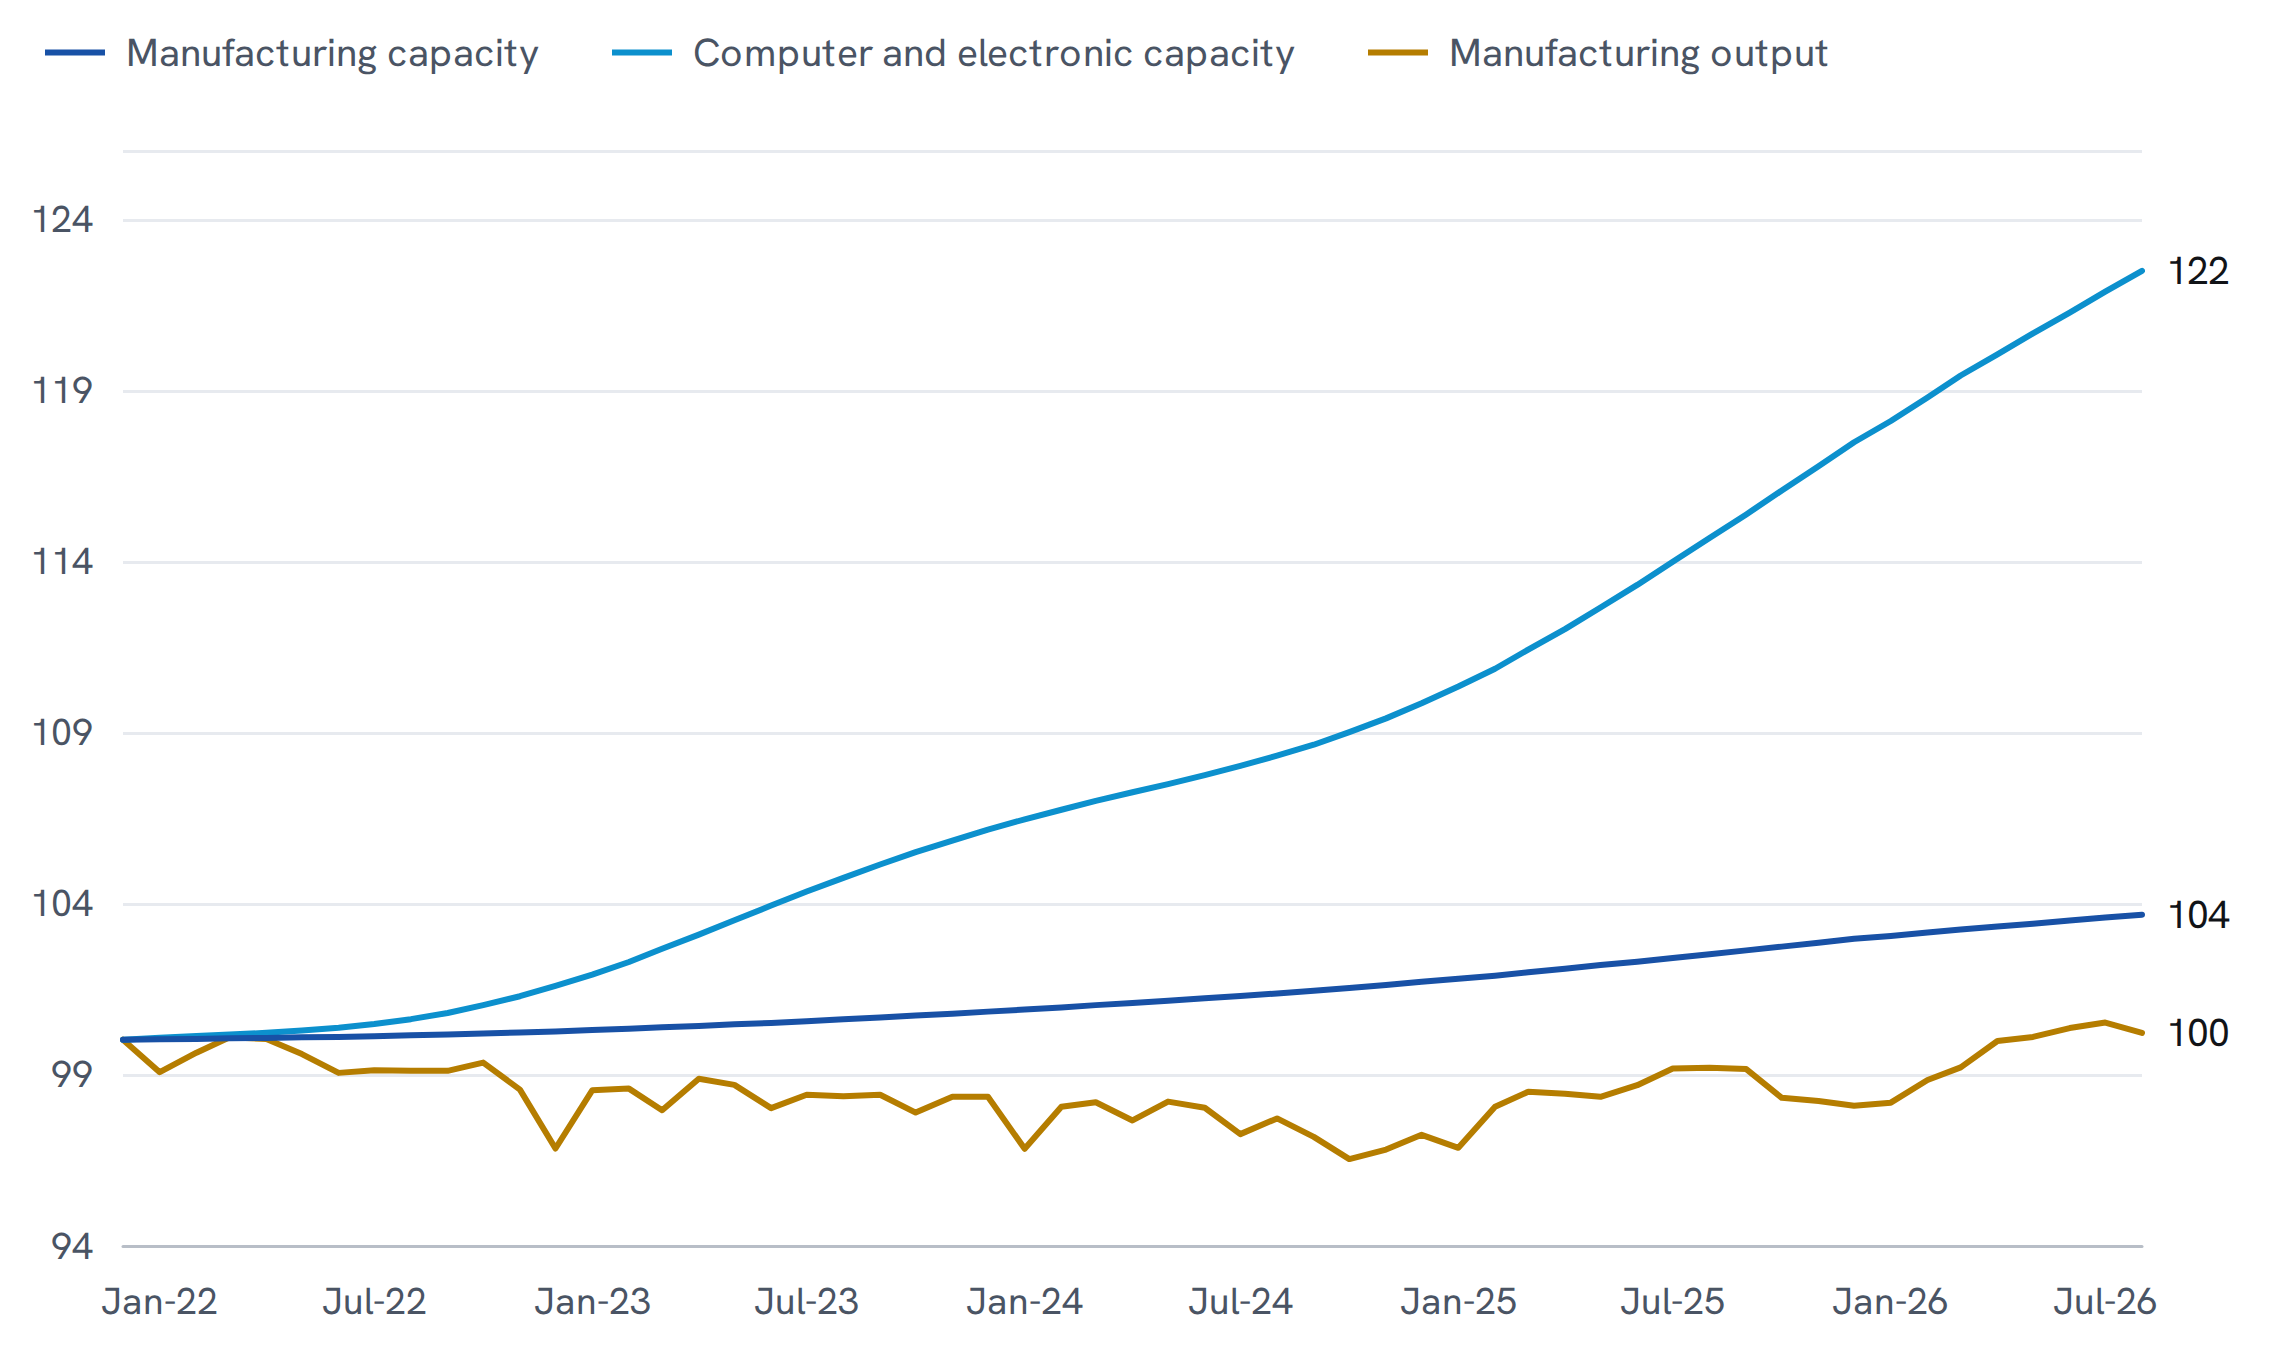
Industrial capacity for manufacturing and for computer and electronic products, and industrial production for manufacturing, United States, monthly from December 2021 to August 2026, each indexed to December 2021 = 100.
Source: Board of Governors of the Federal Reserve System, G.17 Industrial Production and Capacity Utilization, release of 18 September 2026, retrieved from FRED, Federal Reserve Bank of St Louis, on 25 September 2026.
August 2026 is a preliminary estimate. Indexing to a common base is the only transformation; no series is rescaled against another.
Manufacturing capacity is 3.65 per cent higher than at the end of 2021. Capacity in computer and electronic products is 22.47 per cent higher. Manufacturing output is 0.20 per cent higher, which is to say unchanged, and utilisation has fallen from 78.4 per cent to 75.7. The three series are internally consistent: output divided by capacity gives 75.73 per cent against a published utilisation of 75.74, a residual of a hundredth of a point. The capacity has been added; it is not being used.
Chemicals Contributed More Than Computer and Electronic Products
Where the 3.65 per cent came from can be established rather than assumed. The Federal Reserve publishes a capacity index for each manufacturing subsector and, in the same release, the proportion of industrial production each one accounts for. Weighting the first by the second gives each subsector's contribution to the total in percentage points.
Contributions to Manufacturing Capacity Growth Since 2021
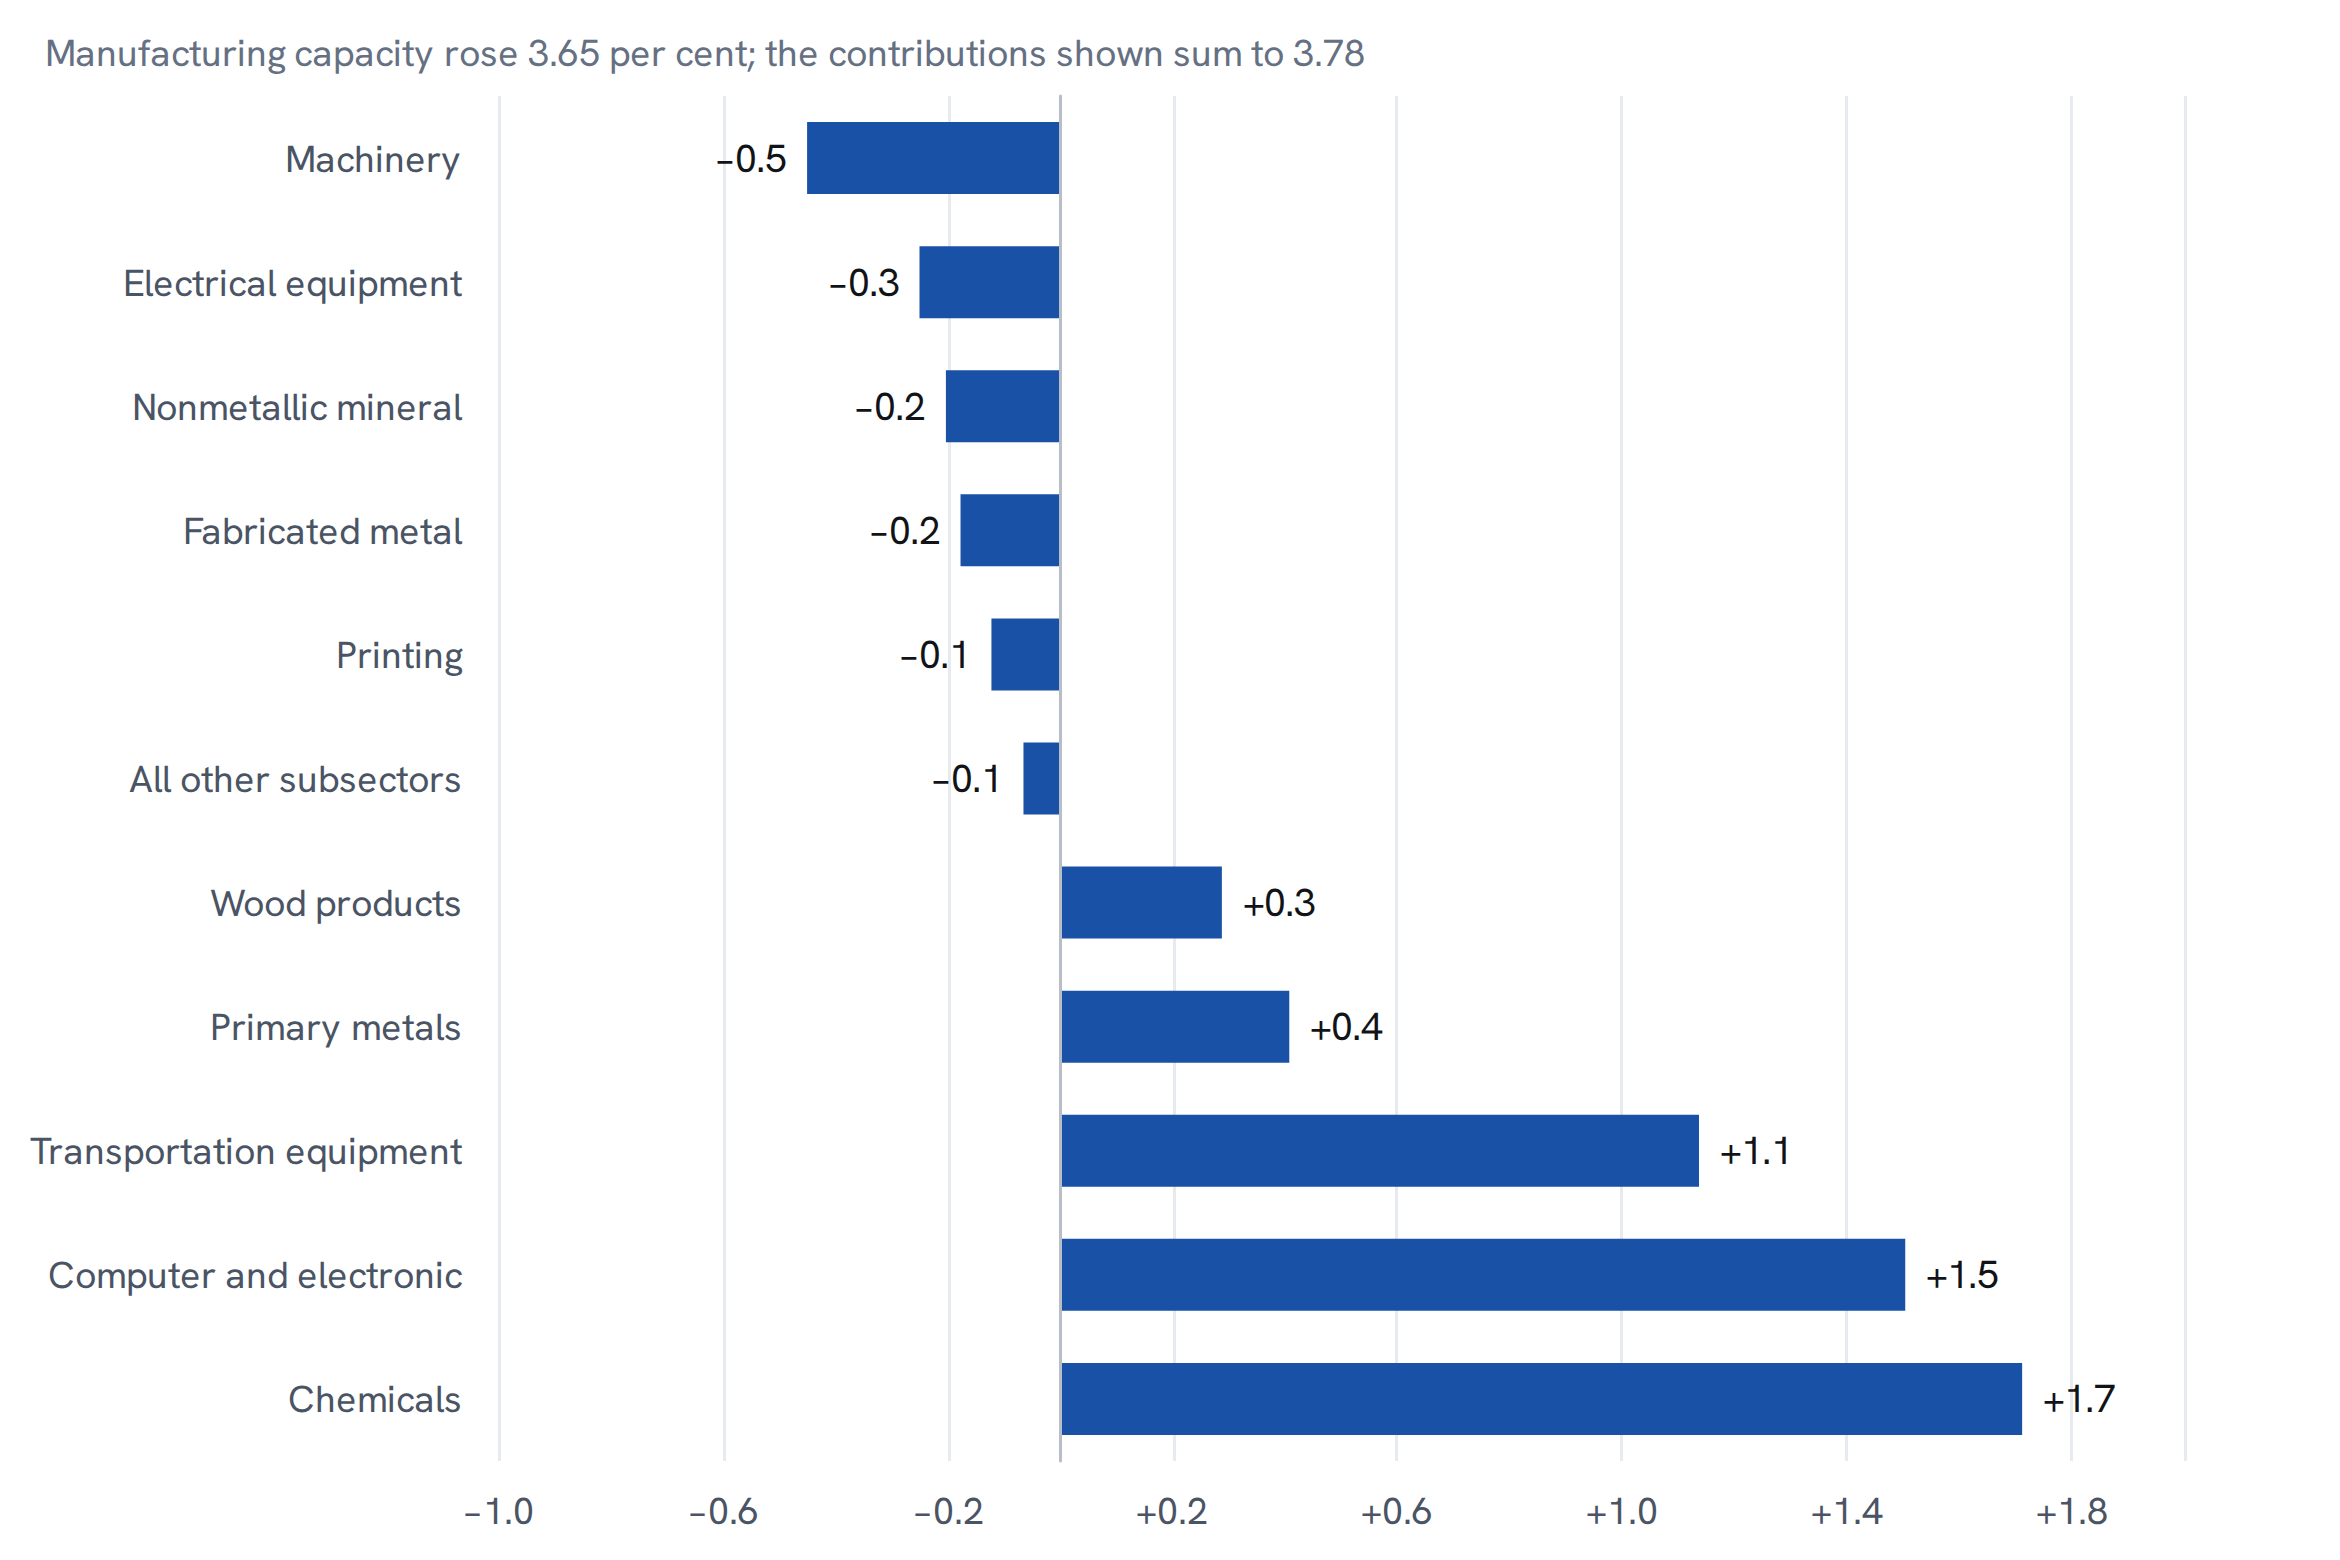
Contribution of each manufacturing subsector to the change in manufacturing capacity between December 2021 and August 2026, percentage points. The ten largest contributions in absolute terms are shown separately and the remaining eight are combined.
Source: Board of Governors of the Federal Reserve System, G.17 Industrial Production and Capacity Utilization, release of 18 September 2026, retrieved from FRED, Federal Reserve Bank of St Louis, on 25 September 2026. Seven Measures calculations.
Each contribution is the subsector's capacity growth multiplied by its share of manufacturing industrial production on the Federal Reserve's 2025 proportions, held fixed. The eighteen contributions sum to 3.78 percentage points against a published aggregate of 3.65, a residual of 0.13 points that arises because the published index is chain-weighted and these weights are not.
Chemicals contributed 1.71 percentage points and computer and electronic products 1.50, with transportation equipment third at 1.14. The subsector that took two thirds of the construction money is therefore not the largest single source of the capacity, because it is 6.7 per cent of manufacturing production and chemicals are 16.0 per cent: a smaller percentage rise on a larger base does more work. The aggregate is also a net figure. Positive contributions come to 5.27 percentage points and negative ones subtract 1.49, and ten of the eighteen subsectors have less capacity today than at the end of 2021, machinery 6.1 per cent less and electrical equipment 8.1 per cent less. Some of what was built has been offset by what was retired elsewhere.
A Third of the Increase Was Price
The spending series is in current dollars, and the cost of building an industrial plant did not hold still. Deflating by the producer price index for new industrial building construction separates the two.
Factory Construction in Current Dollars and in 2021 Prices
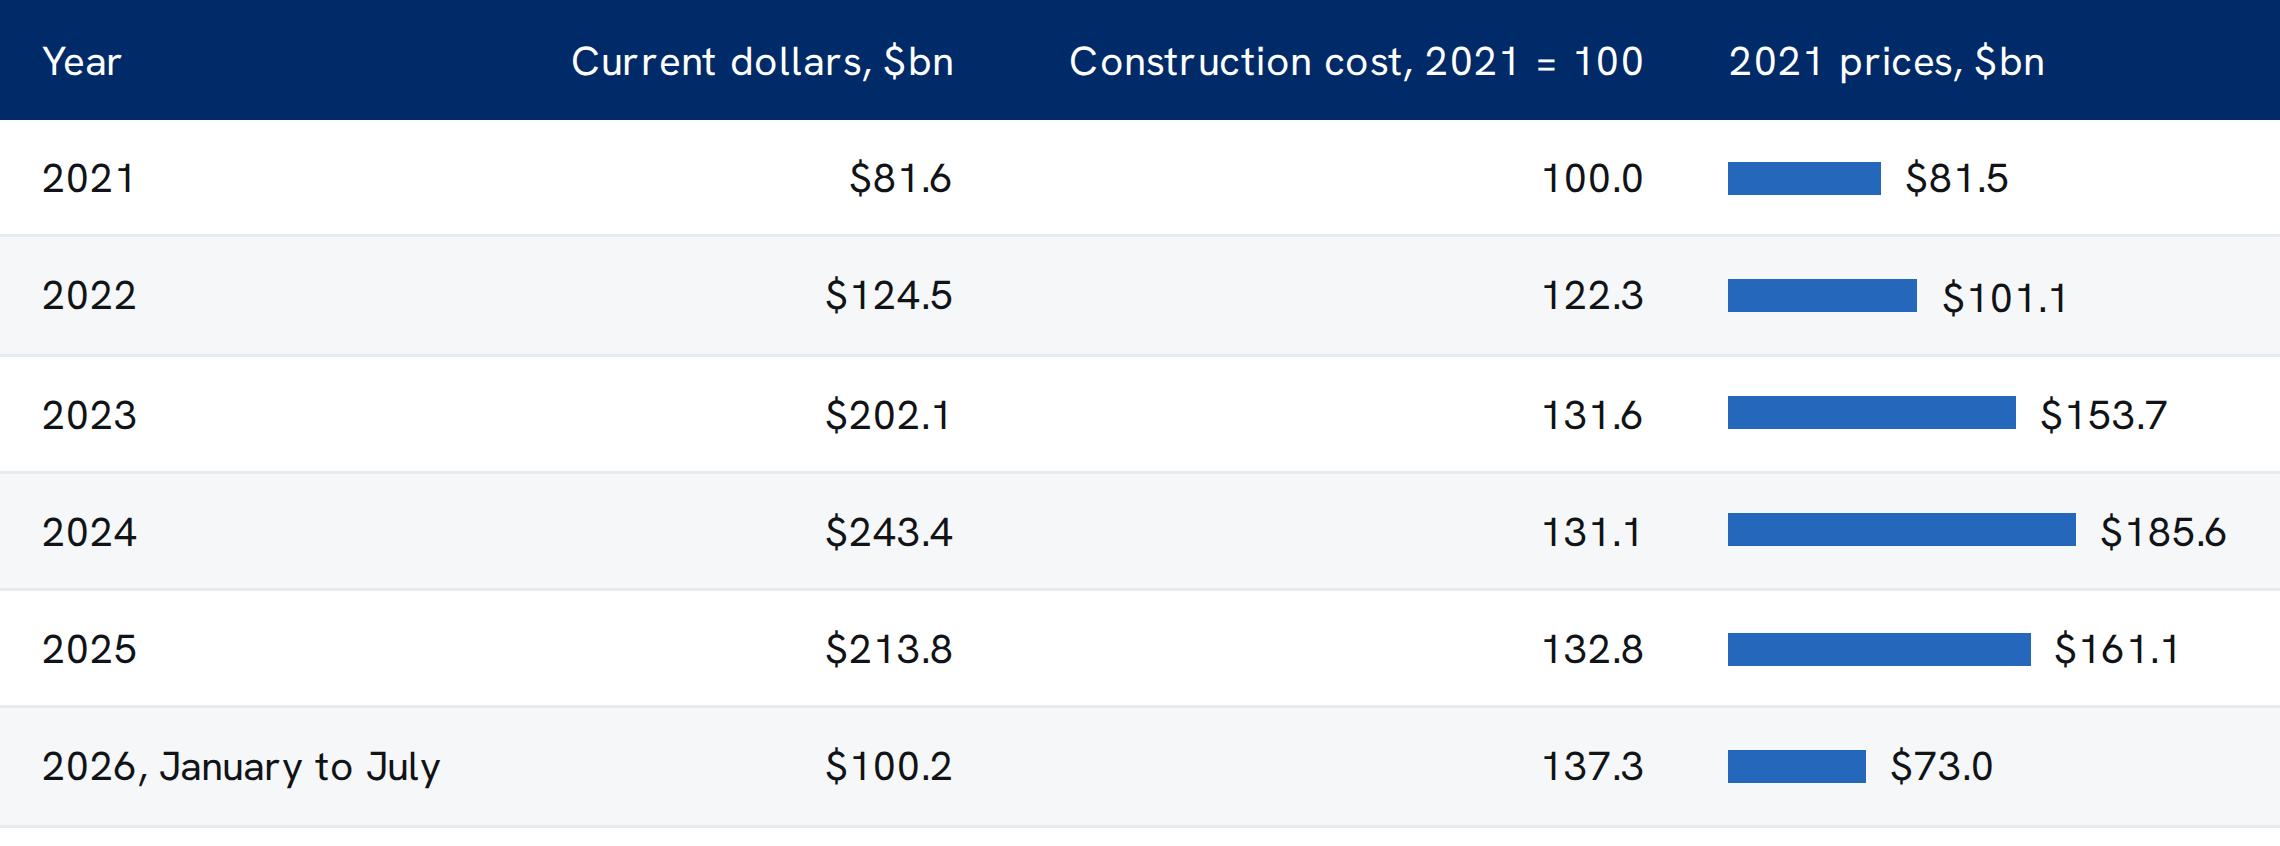
Value of private construction put in place on manufacturing structures, United States, annual totals in current dollars and in 2021 prices, 2021 to July 2026. The 2026 row covers January to July only.
Source: U.S. Census Bureau, Value of Private Construction Put in Place, Construction Spending release of 1 September 2026; U.S. Bureau of Labor Statistics, Producer Price Index by Industry: New Industrial Building Construction, retrieved from FRED, Federal Reserve Bank of St Louis, on 25 September 2026. Deflation is a Seven Measures calculation.
Each month is deflated by that month's index, rebased so that the 2021 average is 100. The deflator is the output price of industrial building construction and is not specific to any subsector.
Spending in 2024 was 2.98 times the 2021 level in current dollars and 2.28 times it in constant prices. Of the $161.7bn by which annual spending rose between those two years, $57.6bn, or 36 per cent, is the higher price of construction rather than more construction. Across the whole period the $884bn spent is $674bn of building at 2021 prices. The cost of an industrial building rose 29.6 per cent between December 2021 and July 2026, which is roughly eight times the rise in the capacity that the period produced.
Investment Implications
The firm reads three things from this. The first is that the headline construction number and the capacity number answer different questions, and the one that decides what the economy can make is the second. A reader watching $884bn of factory building would infer a large increase in industrial capacity. The published capacity index records 3.65 per cent, of which the largest single piece is chemicals rather than semiconductors, and the production that would use it has not moved at all.
The second is that the composition of the decline matters more than its size. With 97.5 per cent of the year-on-year fall in one category, the remaining subsectors are building at close to the rate they were, and a further decline in the aggregate is largely a statement about semiconductor and electronics plant rather than about American manufacturing investment generally.
The third is what the arithmetic of weights implies for what is still to come. The plant now completing is concentrated in a subsector that is 6.7 per cent of manufacturing production. Our base case assumes that as the 2023 and 2024 electronics projects qualify, computer and electronic capacity keeps rising at something like its recent pace while aggregate manufacturing capacity continues to grow in the range the last four years have produced, because a 6.7 per cent weight cannot move the total far and ten subsectors are still contracting. A sustained re-acceleration in chemical or transportation-equipment construction, which are not the categories now falling, would raise the likelihood of a different path, as would completions arriving faster than the index has so far recorded them.
What would resolve it is observable and dated. The monthly Census release carries the subsector split of the spending, the G.17 carries capacity by subsector, and the Federal Reserve's annual capacity revision restates the history. The work this note has not done, and which would sharpen it, is to match individual plant completions to the subsector capacity series, which would measure the lag rather than assume it.