New orders for core capital goods, the nondefense equipment orders excluding aircraft that are read each month as a guide to business investment, were $87.6bn in August. That is the highest level in the series, which begins in 1992, and 14.1 per cent more than in August 2025. Shipments of the same goods were $85.0bn, also a record.
The figure is read as a measure of equipment spending. It measures what U.S. manufacturers are paid for equipment, in current dollars. Two things now separate those: what the equipment costs, and how much of it is made abroad. Both have widened enough to change what the record means.
Most of the Record Is Price
The Producer Price Index for private capital equipment rose 4.0 per cent in the year to August, and 32.3 per cent since August 2019.
Core Capital Goods Orders, Monthly
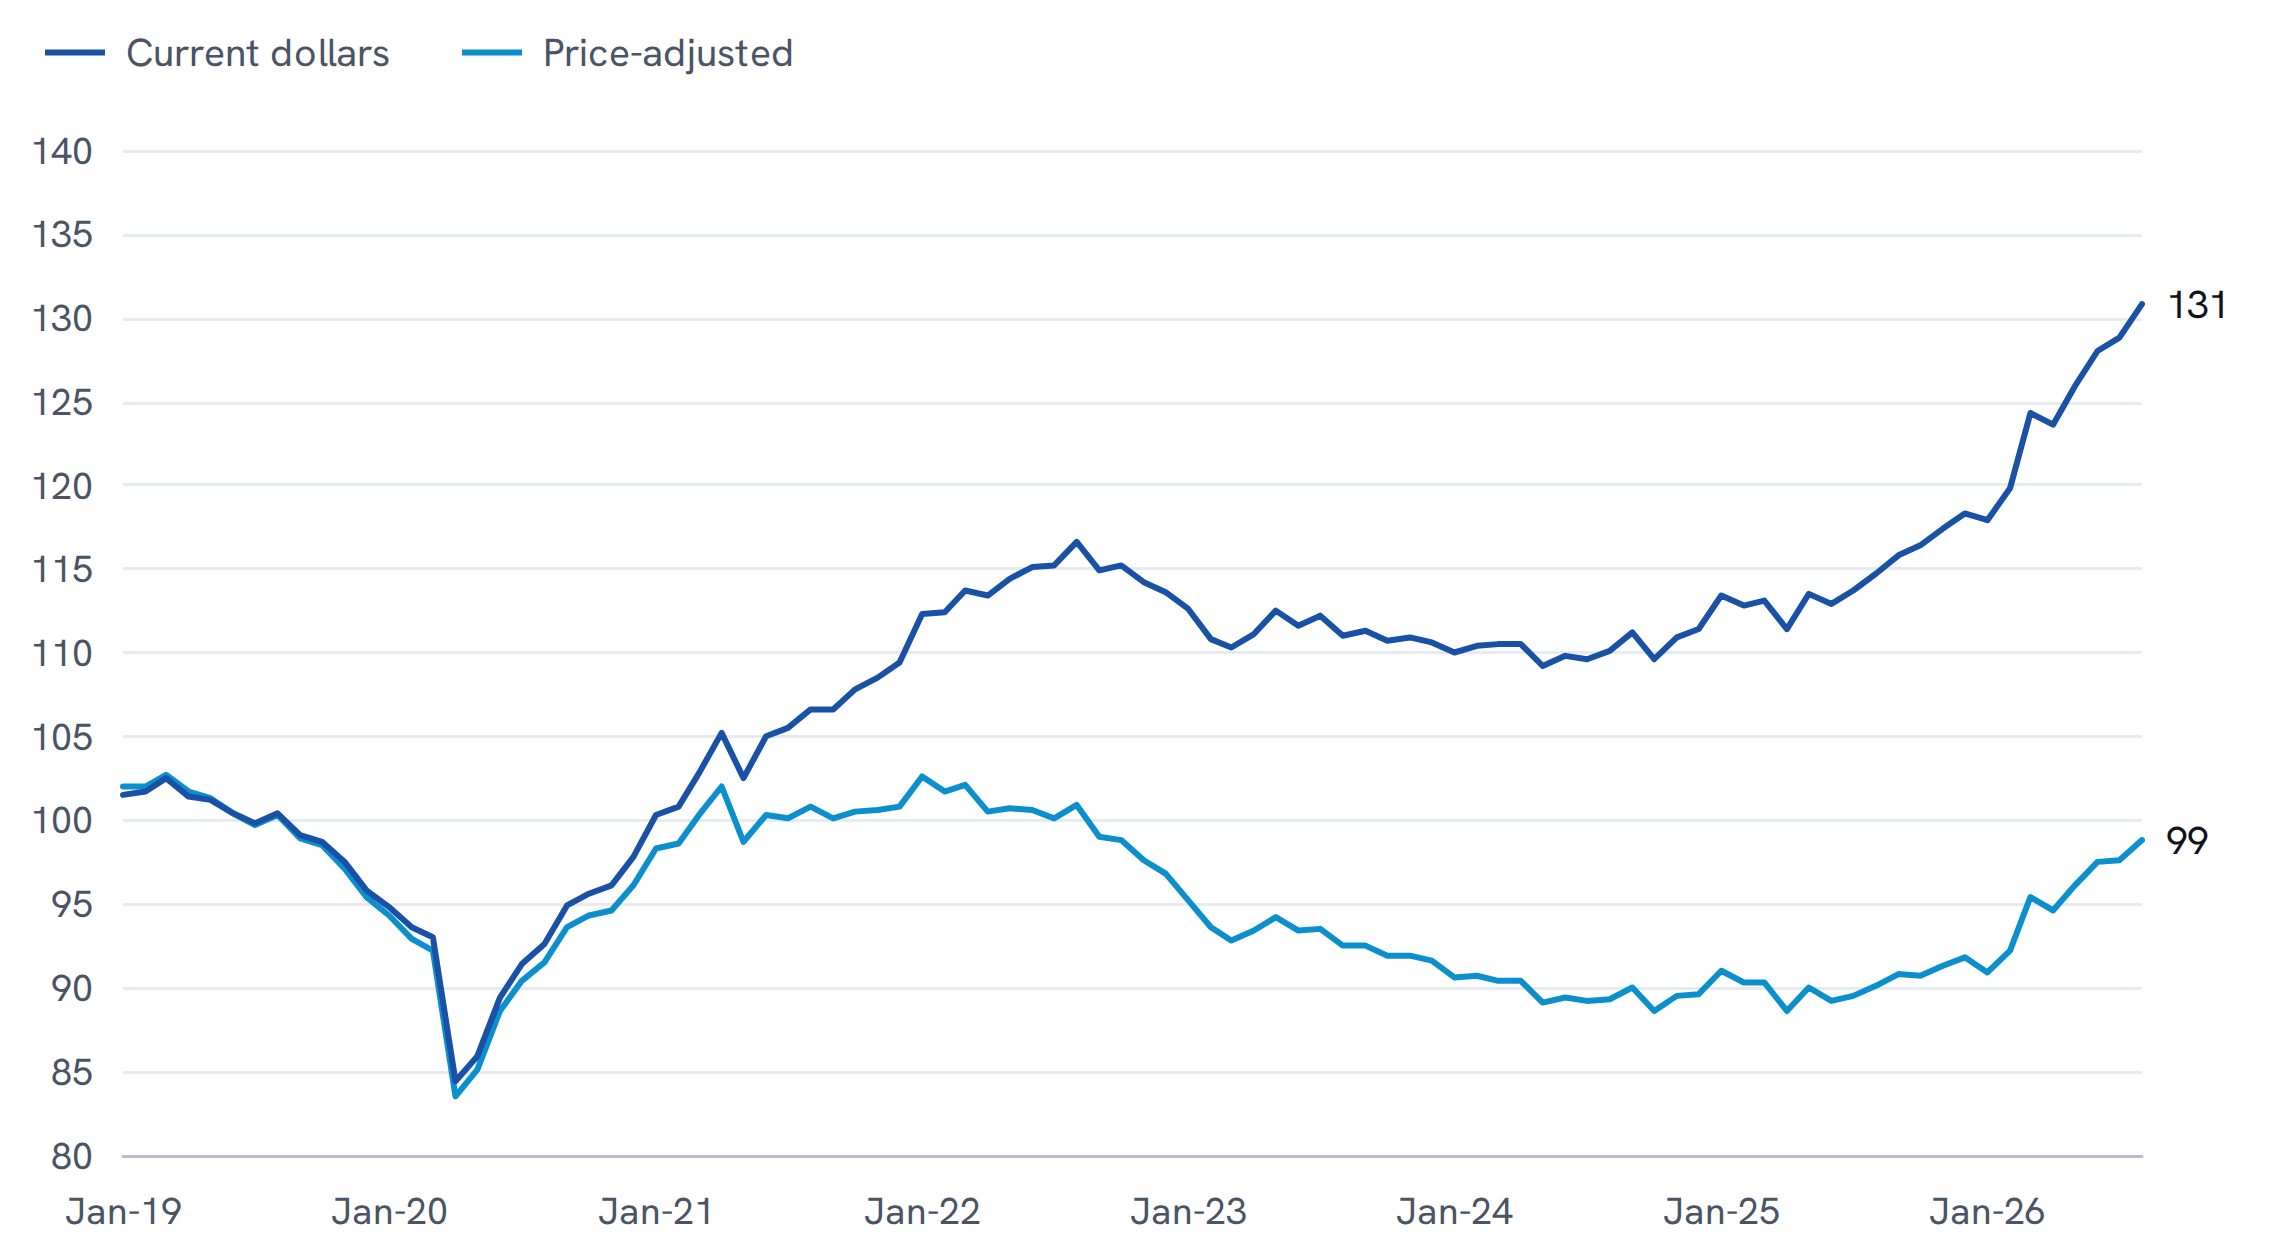
New orders for nondefense capital goods excluding aircraft, seasonally adjusted, January 2019 to August 2026, in current dollars and divided by the Producer Price Index for private capital equipment; 2019 average = 100.
Source: U.S. Census Bureau, Manufacturers' Shipments, Inventories, and Orders; U.S. Bureau of Labor Statistics, Producer Price Index; retrieved from FRED, Federal Reserve Bank of St Louis, on 16 October 2026. Seven Measures calculations.
Of the 14.1 per cent rise in orders over the year, 4.0 points is price and 9.7 per cent is volume, with 0.4 points from the two compounding. That is a real increase, and most of the rise over the year. But it follows a long decline. Adjusted for prices, orders fell from 102.6 per cent of their 2019 average in January 2022 to 88.6 per cent in October 2024. In August they stood at 98.8 per cent. In current dollars they are 30.8 per cent above it.
Shipments tell the same story. Price-adjusted, they rose 7.0 per cent over the year and are 3.5 per cent lower than in August 2019. U.S. manufacturers are shipping roughly the volume of capital equipment they shipped before the pandemic, at prices about a third higher.
The Investment Is Arriving Through Imports
Equipment investment in the national accounts tells a different story. It was $1,923bn at an annual rate in the second quarter of 2026, 54.9 per cent more than in 2019 in current dollars. In the Bureau of Economic Analysis's own price-adjusted terms it was 28.8 per cent higher, and 11.2 per cent higher than a year earlier.
Equipment Investment, Imports and Domestic Shipments
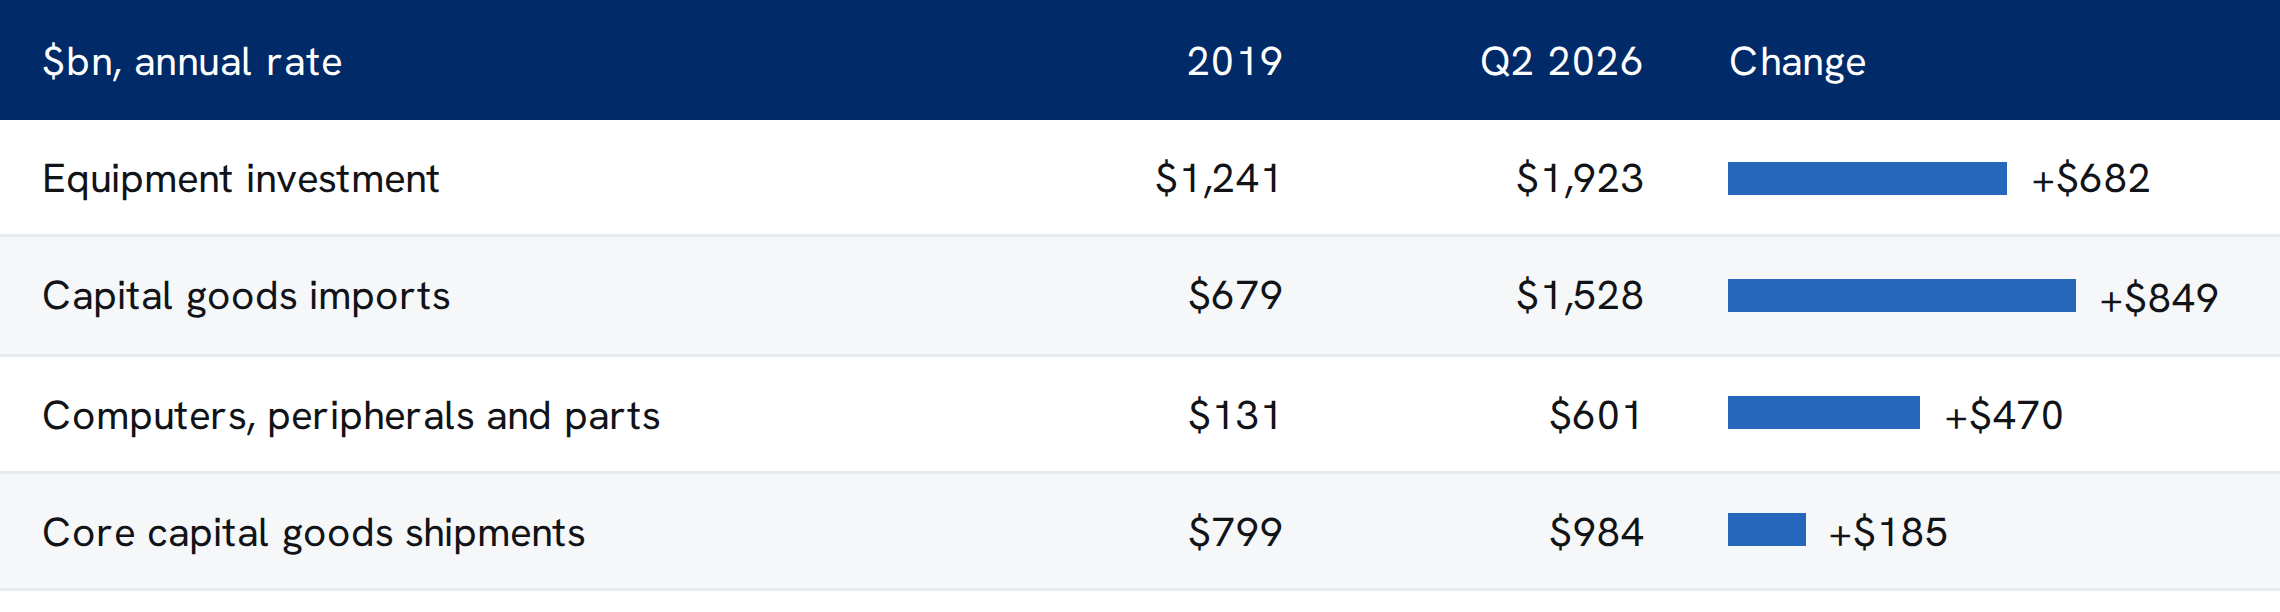
Private nonresidential equipment investment, imports of capital goods except automotive, and the computers, peripherals and parts within them, $bn at seasonally adjusted annual rates, 2019 average and second quarter of 2026; shipments of nondefense capital goods excluding aircraft, monthly averages multiplied by twelve, for the same periods.
Source: U.S. Bureau of Economic Analysis, National Income and Product Accounts, as updated on 30 September 2026; U.S. Census Bureau, Manufacturers' Shipments, Inventories, and Orders; retrieved from FRED, Federal Reserve Bank of St Louis, on 16 October 2026. Seven Measures calculations.
Changes are calculated from the rounded levels shown. Imports are not a component of investment, and the rows are not additive.
Since 2019, equipment investment has risen $682bn a year. Over the same period capital goods imports rose $849bn, and the shipments of core capital goods by U.S. manufacturers rose $185bn. Computers, peripherals and parts alone account for $470bn of the increase in imports: they were 19 per cent of capital goods imports in 2019 and 39 per cent in the second quarter of 2026. Over the last year they rose 80.4 per cent, from $333bn to $601bn.
The two series measure different things and the gap cannot be read as a straight substitution. What it does show is where the growth is. Over the year to the second quarter, capital goods imports rose 39.7 per cent and domestic core shipments 8.4 per cent.
Domestic Computer Output Is Falling
The domestic shipments behind the orders figure come from three industries, and they are moving in different directions.
Price-Adjusted Shipments by Industry
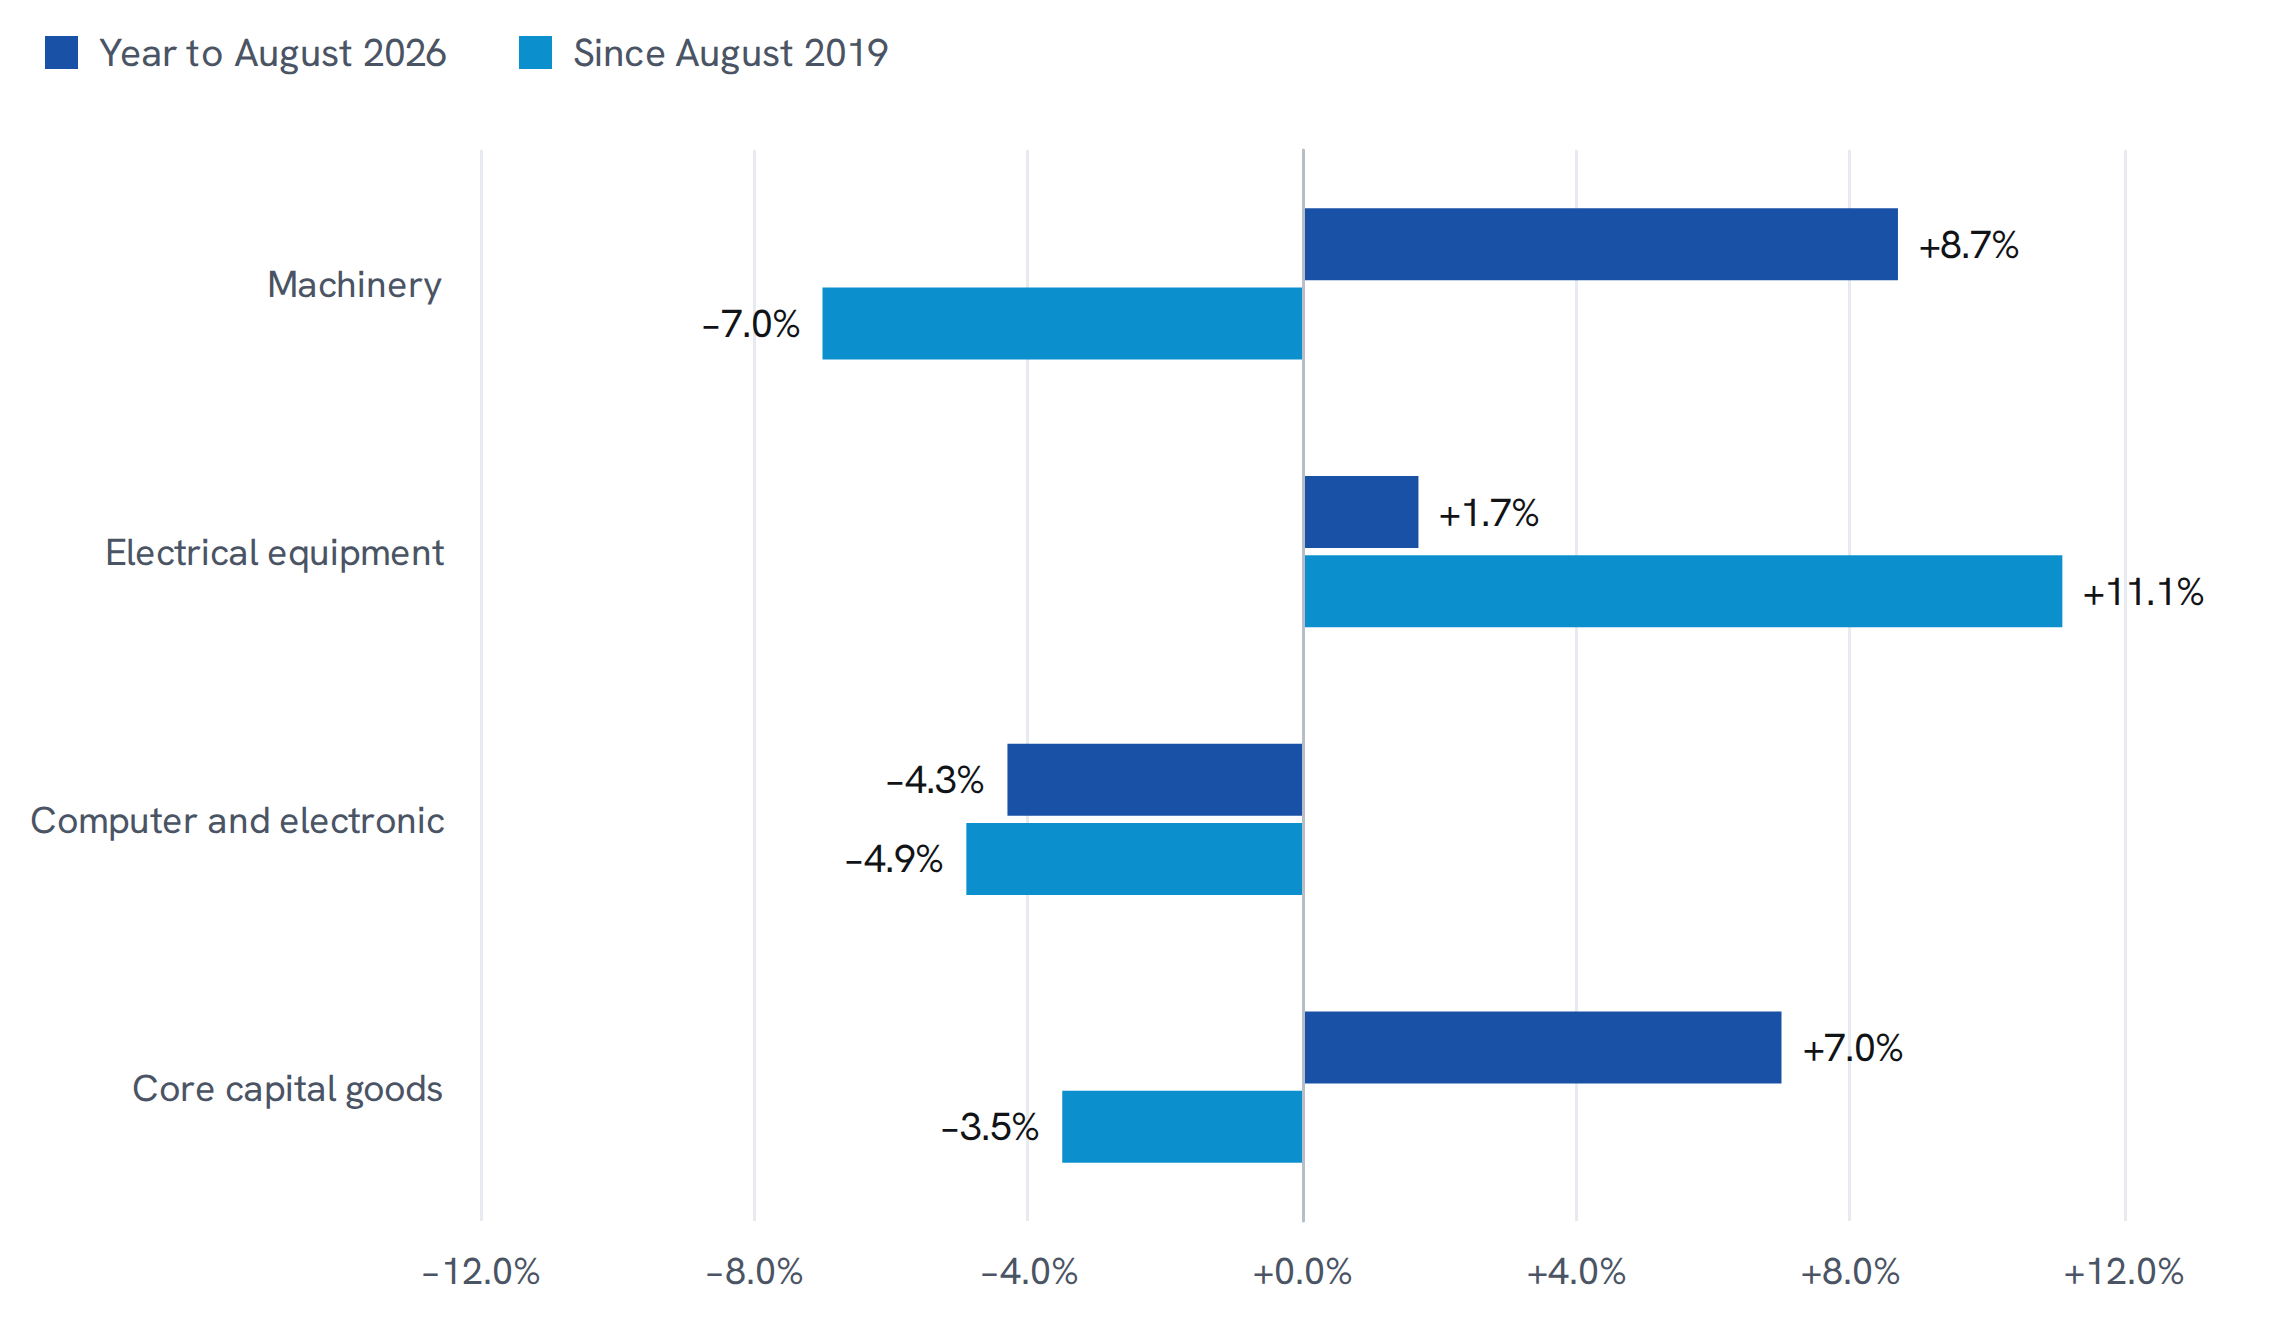
Percentage change in the value of shipments, seasonally adjusted, divided by the Producer Price Index for the same industry, to August 2026; core capital goods divided by the index for private capital equipment.
Source: U.S. Census Bureau, Manufacturers' Shipments, Inventories, and Orders; U.S. Bureau of Labor Statistics, Producer Price Index; retrieved from FRED, Federal Reserve Bank of St Louis, on 16 October 2026. Seven Measures calculations.
Industry shipments include products that are not capital goods. Industry price indexes are not seasonally adjusted and are compared over twelve-month or seven-year spans.
Machinery carried the year, up 8.7 per cent after prices, though it remains 7.0 per cent below August 2019. Electrical equipment, which includes transformers and switchgear, is the only one of the three above its 2019 level, by 11.1 per cent. Computer and electronic products shipped 8.1 per cent more in dollars over the year, but the industry's producer prices rose 13.0 per cent, so the volume fell 4.3 per cent. Within that industry, the price index for printed circuit assembly manufacturing rose 130.6 per cent in the year to August.
The fastest-growing category of capital goods imports is computing equipment, while the domestic industry that makes related products is shipping less of them at much higher prices.
Investment Implications
The firm reads one thing from this. The core capital goods figure is a measure of U.S. manufacturers' order books, and it is read as a measure of equipment spending. On the current data the two have parted. The current-dollar record is largely price, and imported computers, the fastest-growing part of capital goods imports, do not pass through the domestic order book at all.
Our base case assumes imports of computers, peripherals and parts stay near their second-quarter rate, so equipment investment in the third quarter continues to grow faster than domestic core shipments, and capital equipment prices keep rising at about their recent annual pace of 4 per cent. A fall in computer imports, or a shift of that production to domestic plants that shows up in computer and electronic shipments, would raise the likelihood of a different path, in which the two measures converge again.
What resolves it is dated. The Census Bureau's advance report for September orders is scheduled for 27 October, and the Bureau of Economic Analysis's first estimate of third-quarter investment and imports for 29 October. The work this note has not done is to split computer imports between finished equipment and parts, which the detailed trade statistics would allow.